Digital image analysis to quantify genetic divergence in passion fruit seeds
Received: March 28, 2019
Accepted: March 30, 2019
Published: May 05, 2019
Genet.Mol.Res. 19(5):
Keywords
Phenotyping; Quality; Seeds; Ward-MLM.
Introduction
Fruticulture is one of the main agricultural activities. The fruit fresh consumption and industry processing markets had a steady growth in recent years. This growth was mainly due to changes in the pattern of consumption of people who seek healthier diets. The world fruit production surpassed 865,876 Mg in 2016 and has an estimated annual growth of 1.1% to 2% (FAO, 2016). Brazil is the third largest fresh fruit producer, offering tropical and temperate climate fruits throughout the year because of its territorial extension, geographical position, and edaphoclimatic conditions.
Passion fruit (Passiflora edulis Sims.) is one of these tropical fruits. This species is indigenous to tropical America and is cultivated in several countries around the world. However, passion fruit production is more economically significant in Australia and in Brazil (Schotsmans and Fischer, 2011). Moreover, Brazil is the world's leading producer and consumer of passion fruit, with an estimated of 554,598 Mg, and yield of 13,497 kg ha-1 (IBGE, 2017).
Considering its economic importance, P. edulis has been used in breeding programs in Brazil and Australia to develop more productive cultivars and improve fruit quality and adaptation to different edaphoclimatic conditions (MC-Carthy and Dick, 2017; Bundock, 2017; Cavalcante et al., 2017; Silva et al., 2017; Tal et al., 2016). However, seed quality has received little attention in these programs, despite the importance of the seeds for the success of the establishment and production of passion fruit crops (Ocampo et al., 2016).
Seed quality comprises several characteristics that determine its suitability for sowing. Genetic, physical, physiological, and sanitary attributes of the seeds are used to evaluate seed quality, estimating the seed performance potential after sowing, or during storage (Yang and Wen, 2016; Bishaw et al., 2007). The seed physiological quality determines its ability to perform vital functions responsible for germination, vigor, and longevity, which directly affect crops under field conditions (Popinigis, 1977). However, many tests used to evaluate seed physiological characteristics require time and skilled labor, making it a costly process (Sudhakar et al., 2016, Boelt et al., 2018). However, advancements in computing technology made possible evaluate seed morphological characteristics through phenotyping. Phenotyping has been used to increase accuracy and speed in evaluations of seed and seedling morphological characteristics. The data obtained with phenotyping has assisted in determining the seed cultivar, color, mechanical damages, and size class (Dell´Aquila, 2009; Fiorani and Schurr, 2013).
Digital image analysis is a fast, reliable, and non-destructive technique for phenotyping. It provides accurate information of seed size, shape, texture, and color through digital images to quantify genetic divergence (Santos et al., 2014; Krause et al., 2017).
Multivariate techniques such as the Ward-Modified Location Model (Ward-MLM) proposed by Franco et al. (1998) have been used to quantify genetic divergence. This method allows simultaneous analysis of quantitative and qualitative variables, determines an optimal number of groups, and identifies the probability of allocation of each accession to a given group (Gonçalves et al., 2009; Santos et al., 2014; Krause et al., 2017). In this context, the objective of this work was to evaluate the use of morphophysiological characteristics of seeds to quantify genetic divergence among full-sibling families of passion fruit using the Ward-MLM method, identify the seed descriptors that most contribute to the genetic divergence, and define heterotic groups using seed morphophysiological descriptors.
Materials and Methods
Seeds of 98 full-sibling families (FSF) from the breeding program of the Mato Grosso State University (Unemat) were evaluated. The fruits of each FSF were harvested in June and July 2016, when the fruits reached physiological maturity—yellow color in more than 70% of the fruit peel (Oliveira et al., 2017). The fruits were taken to a laboratory and cut open. The seeds were removed, washed in running water in a nylon sieve to remove the pulp, dried for two days at room conditions to remove excess moisture, and then cleaned, and stored in a cold room at 7°C (Silva et al., 2015).
Seed physiological analysis
The weight of 1,000 seeds (1000SW) was evaluated using the weights of eight samples of 100 seeds per FSF, which were converted into 1000SW and expressed in grams (g) with accuracy of 0.1 g (Brasil, 2009). The water content (WC) of the seeds was evaluated using the oven method at 105±3 ºC for 24 hours, as described in Brasil (2009). Four samples of 100 seeds per FSF were weighed before and after the drying period and their WC were expressed as percentage of moisture (%).
Seed germination percentage (SGP) was evaluated using 25 seeds per FSF with four replications. Germination test paper rolls moistened with distilled water (2.5-fold the paper dry weight) were used as substrate for germination of the seeds. These rolls were placed in a BOD germination chamber, with alternated temperature of 20°C to 30°C, and 12-hour photoperiod (the 12-hour light period corresponded to the temperature of 30°C) for 30 days (Brasil, 2009). The SGP was then obtained considering the number of germinated seeds after 30 days for each replication of the treatments and expressed as percentage. Germination speed index (GSI) was evaluated simultaneously to the SGP test; germinated seeds were evaluated daily for 30 days, considering germinated those seeds with broken tegument, and radicle emission length of at least 2 mm (Hadas, 1976). The GSI data were evaluated according to Maguire (1962).
Seedling emergence percentage (SEP) was evaluated through a seedling emergence test using wooden boxes with sterilized washed sand as substrate, which was initially moistened to 60% of its water retention capacity and, then, moistened when necessary. These boxes were kept in a protected environment at room temperature. Twenty-five seeds were used per FSF with four replications. The seeds were planted at 3 mm depth in rows spaced 5 cm apart and evaluated daily for 45 days (Brasil, 2009). The number of emerged seedlings was then counted and expressed as percentage.
Emergence speed index (ESI) was evaluated together with the SEP test. The number of emerged seedlings was evaluated daily. Emerged seedlings were those with free cotyledons. The ESI was then calculated according to Maguire (1962). Seedling dry weight (SDW) was evaluated after the SEP test, using emerged seedlings. The seedlings were weighed, dried in a forced air-circulation oven at 70 ºC for 72 hours and again weighed. The average dry weights were expressed in grams per seedling. Radicle length (RL) was evaluated using 10 normal seedlings from the SEP test; their radicles were measured using a digital caliper and the results were expressed in centimeters.
Seed morphological analysis
Seed morphological descriptors were evaluated at the Seed Technology Laboratory of the State University of Northern Rio de Janeiro (UENF) in Campos dos Goytacazes, RJ, Brazil, using a seed analysis device (GroundEye®, Lavras, Brazil). Fifty seeds were used for each FSF with four replications. The seeds were placed on a transparent acrylic tray and the tray was placed in the capture chamber of the GroundEye® device for analysis (Figure 1). This device generated a spreadsheet with mean values of the analyzed descriptors for each FSF. The descriptors that presented no variation among FSF were discarded.

Figure 1. Arrangement of the seeds on the transparent acrylic tray to collect images using the GroundEye® seed analysis device.
Statistical analysis
The Ward-MLM proposed by Franco et al. (1998) and used by Viana and Resende (2014) was used to quantify genetic divergence. The Gower index (1971) was used to generate the estimated dissimilarity index, which varies from 0 to 1. The dissimilarity was calculated using the equation
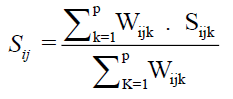
Wherein, k is the number of the descriptor (k = 1, 2…); i and j are the compared individuals in relation to the descriptor k; p is the total number of descriptors evaluated; and Sij is the contribution of the descriptor k to the total distance.
For qualitative variables, Sijk had value 1 when there is a positive or negative agreement for the characteristic k among the individuals i and j. For quantitative variables, Sijk was calculate using the equation
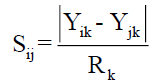
where in Rk is the amplitude of variation of the variable k, assuming values between 0 to 1.
The wijk weight was used to define the contributions of individual Sijk. When the value of the variable k was absent in one or both individuals, wijk is 0, otherwise it is 1.
The ideal number of groups was defined according to the pseudo-F and pseudo T2 criteria by the Ward clustering method (Ward, 1963). According to the ideal number of groups, the hierarchical classification was obtained by the Ward method, which generates the necessary parameters to implement the final step of the MLM model (Crossa and Franco, 2004). The differences between groups and between canonical variables were analyzed graphically. The analyses were performed using the SAS statistical program (SAS Institute, 2009). Diagrams were developed using the Sigma Plot 14.0 program.
Different strategies to quantify genetic divergence were used in the analysis. The Ward-MLM method was applied to each group of color, geometry, and texture descriptors, evaluating the contribution of the descriptors to quantify genetic divergence among the FSF, and identifying those that presented the highest correlations with the first canonical variable. Subsequently, 30% of the descriptors that contributed the most to quantify genetic divergence within each group were analyzed, except for the physiological group, which was analyzed using all descriptors.
Results
Forty-four of the 150 morphological descriptors evaluated were discarded because they had no variation among the FSF, leaving 106 descriptors—35 color, 42 geometry, and 29 texture descriptors. Table 1 presents the canonical variables and the morphological descriptors that contributed the most to quantify genetic divergence within each descriptor set, and their contribution values. These results were used to quantify genetic divergence among FSF.
| Group | Descriptor | CV1 | CV2 |
|---|---|---|---|
| Color | C3 | 0.887 | -0.104 |
| C5 | 0.842 | 0.011 | |
| C13 | 0.902 | -0.074 | |
| C15 | 0.841 | 0.013 | |
| C20 | 0.840 | -0.092 | |
| C22 | 0.903 | 0.023 | |
| C23 | -0.882 | -0.002 | |
| C30 | 0.897 | -0.064 | |
| C32 | 0.839 | -0.060 | |
| C33 | 0.904 | -0.039 | |
| Geometry | G1 | 0.894 | -0.150 |
| G5 | 0.882 | -0.148 | |
| G7 | 0.859 | -0.104 | |
| G10 | 0.888 | -0.166 | |
| G11 | 0.612 | 0.116 | |
| G18 | -0.802 | 0.140 | |
| G21 | -0.889 | 0.166 | |
| G22 | 0.716 | -0.151 | |
| G23 | 0.652 | -0.155 | |
| G24 | -0.747 | 0.125 | |
| G27 | -0.764 | 0.341 | |
| G41 | 0.641 | -0.083 | |
| Texture | T3 | 0.683 | 0.340 |
| T4 | 0.624 | -0.381 | |
| T5 | 0.638 | 0.358 | |
| T6 | 0.669 | -0.335 | |
| T19 | 0.630 | -0.206 | |
| T22 | 0.640 | -0.333 | |
| T26 | -0.649 | 0.337 | |
| T28 | 0.600 | 0.197 | |
| T29 | -0.631 | 0.145 |
Color descriptors: C3 = below the Otsu threshold: green channel; C5 = bellow the Otsu threshold: CIELab: b; C13 = brightness; C15 = CIELab: b; C20 = CIELab: L; C22 = orange dominance; C23 = black dominance; C30 = medium: red channel; C32 = predominant: green channel; C33 = predominant: red channel. Geometry descriptors: G1 = thinning; G5 = circularity by shape factor; G7 = circularity by FFCm; G10 = contour convexity; G11 = contour deformation; G18 = sphericity of the shape; G21 = contour irregularity; G22 = change of segments of lines in the perimeter; G23 = change in perimeter; G24 = number of gaps; G27 = perimeter; G41 = solidity of the contour. Texture descriptors: T3 = Haralick: dissimilarity; T4 = Haralick: energy; T5 = Haralick: entropy; T6 = Haralick: homogeneity; T19 = run length: GLD; T22 = run length: LRE; T26 = run length: SER; T28 = SFM: space frequency measure; T29 = SFM: modified space frequency measure.
Table 1. Contribution of the first two canonical variables (CV) of color, texture, and geometry descriptors formed by the Ward-MLM method using 98 full-sibling families of passion fruit.
The morphological descriptors that most contributed to quantify genetic divergence among FSF (10 color, 12 geometry, 9 texture descriptors), and eight physiological descriptors formed three groups, despite the reduced number of morphological, and addition of physiological descriptors (Table 2). The number of FSF varied among the groups formed; group II had the highest number of FSF (51), followed by group I (41) and III (6). The largest distance was found between groups II and III (223,160) (Table 2).
| Group | I (41 FSF) | II (51 FSF) | III (6 FSF) |
|---|---|---|---|
| I | 0 | 30.360 | 129.190 |
| II | - | 0 | 223.160 |
| III | - | - | 0 |
Table 2. Groups formed by the Ward-MLM method, number of full-sibling families (FSF) in each group, and distance between the groups to quantify genetic divergence among FSF of passion fruit.
The first two canonical variables (CV) represented 100% of the variance; CV1 explained 84.09% and CV2 explained 15.91% of the variance of the descriptors evaluated, distancing group III from group I and II, and approximating groups I and II (Figure 2).

Figure 2. Dispersion of the first two canonical variables (CV1 and CV2) representing the three groups formed by the Ward-MLM method using 39 quantitative descriptors of 98 full-sibling families of passion fruit.
The geometric descriptor set contributed the most to quantify genetic divergence, followed by the color, texture, and physiological descriptor sets (Table 3). The descriptors contour irregularity (G21), contour convexity (G10), thinning (G1), circularity by shape factor (G5), and circularity by FFCm (G7) contributed the most to the quantify genetic divergence among FSF.
| Group | Descriptor | CV1 | CV2 |
|---|---|---|---|
| Color | C3 | 0.714 | -0.294 |
| C5 | 0.669 | -0.190 | |
| C13 | 0.702 | -0.252 | |
| C15 | 0.661 | -0.185 | |
| C20 | 0.662 | -0.248 | |
| C22 | 0.651 | -0.260 | |
| C23 | -0.648 | 0.250 | |
| C30 | 0.700 | -0.243 | |
| C32 | 0.667 | -0.305 | |
| C33 | 0.691 | -0.312 | |
| Geometry | G1 | 0.802 | 0.205 |
| G5 | 0.788 | 0.116 | |
| G7 | 0.779 | 0.203 | |
| G10 | 0.797 | 0.261 | |
| G11 | 0.515 | 0.011 | |
| G18 | -0.768 | -0.352 | |
| G21 | -0.797 | -0.260 | |
| G22 | 0.657 | 0.142 | |
| G23 | 0.762 | 0.206 | |
| G24 | -0.730 | -0.254 | |
| G27 | -0.775 | -0.325 | |
| G41 | 0.636 | 0.160 | |
| Texture | T3 | 0.284 | -0.054 |
| T4 | -0.415 | 0.047 | |
| T5 | 0.369 | -0.045 | |
| T6 | -0.310 | 0.092 | |
| T19 | -0.106 | 0.022 | |
| T22 | -0.317 | 0.143 | |
| T26 | 0.292 | -0.120 | |
| T28 | 0.506 | -0.032 | |
| T29 | 0.488 | -0.018 | |
| Physiology | SDW | -0.059 | 0.010 |
| RL | -0.002 | -0.199 | |
| ESI | 0.057 | -0.076 | |
| SEP | 0.062 | -0.076 | |
| GSI | -0.183 | -0.002 | |
| SGP | -0.077 | -0.102 | |
| WC | 0.155 | 0.159 | |
| 1000SW | -0.167 | -0.029 |
Color descriptors: C3 = below the Otsu threshold: green channel; C5 = bellow the Otsu threshold: CIELab: b; C13 = brightness; C15 = CIELab: b; C20 = CIELab: L; C22 = orange dominance; C23 = black dominance; C30 = medium: red channel; C32 = predominant: green channel; C33 = predominant: red channel. Geometry descriptors: G1 = thinning; G5 = circularity by shape factor; G7 = circularity by FFCm; G10 = contour convexity; G11 = contour deformation; G18 = sphericity of the shape; G21 = contour irregularity; G22 = change of segments of lines in the perimeter; G23 = change in perimeter; G24 = number of gaps; G27 = perimeter; G41 = solidity of the contour. Texture descriptors: T3 = Haralick: dissimilarity; T4 = Haralick: energy; T5 = Haralick: entropy; T6 = Haralick: homogeneity; T19 = run length: GLD; T22 = run length: LRE; T26 = run length: SER; T28 = SFM: space frequency measure; T29 = SFM: modified space frequency measure. Physiological descriptors: SDW = seedling dry weight; RL= radicle length; ESI = emergence speed index; SEP = seedling emergence percentage; GSI = germination speed index; SGP = seed germination percentage; WC = water content; 1000SW = 1,000 seed weight.
Table 3. Contributions of the first two canonical variables (CV) formed by the Ward-MLM method to quantify genetic divergence among 98 full-sibling families of passion fruit.
The means of the physiological descriptors (Table 4) showed that group III had the highest means of SDW (0.414), RL (63.072), GSI (2.503), SGP (0.900), and 1000SW (26.499); group II had the highest means of ESI (1.106), and SEP (0.658); and group I had the highest mean of WC (11.013).
| Physiological descriptor | Group | Overall mean | ||
|---|---|---|---|---|
| I (41) | II (51) | III (6) | ||
| SDW (g) | 0.393 ± 0.20 | 0.378 ± 0.14 | 4.140 ± 0.21 | 0.393 ± 0.18 |
| RL (cm) | 5.62 ± 1.20 | 5.94 ± 1.10 | 6,30 ± 0,94 | 5.94 ± 1.14 |
| ESI | 1.065 ± 0.28 | 1.106 ± 0.19 | 1.084 ± 0,20 | 1.084 ± 0,24 |
| SEP (%) | 63.40 ± 0.16 | 65.80 ± 0.10 | 64.30 ± 0.11 | 64.30 ± 0.13 |
| GSI | 2.25 ± 10,57 | 2.131 ± 0.51 | 2,503 ± 0.48 | 2.251 ± 0.54 |
| SGP (%) | 83.40 ± 0.13 | 84.10 ± 0.13 | 90.00 ± 0.05 | 84.10 ± 0,13 |
| WC (%) | 11.01 ± 1.75 | 10.96 ± 1.25 | 9.722 ± 1.34 | 10.96 ± 1.51 |
| 1000SW (g) | 2.52 ± 0.26 | 2.49 ± 0.22 | 2.64 ± 0.15 | 2.52 ± 0.23 |
Descriptors: SDW = Seedling Dry Weight; RL = Radicle Length; ESI = Emergence Speed Index; SEP = Seedling Emergence Percentage; GSI = Germination Speed Index; SGP = Seed Germination Percentage; WC = Water Content; 1000SW = 1,000 seed weight.
Table 4. Means and standard deviations of physiological descriptors of three groups formed by the Ward-MLM method using 98 full-sibling families of passion fruit.
Discussion
The Ward-MLM method used to quantify genetic divergence through the likelihood function showed that three was the ideal number of groups, despite the reduced number of morphological descriptors, and addition of physiological descriptors. The formation of three groups denotes a genetic variability that can be explored, allowing the use of these FSF for crosses in breeding programs. Information about genetic diversity is important for plant breeding. It assists in the identification of combinations with high heterosis and increases the perspective of selection of superior segregates because of the increased variability due to the crossing between divergent genotypes (BEZERRA NETO et al., 2010).
Moreover, the formation of the three groups denoted that the use of color, geometry, and texture descriptors measured by digital imaging analysis of seeds was efficient to quantify genetic divergence, even with a reduced number of descriptors (10 color, 12 geometry, and 9 texture descriptors). These results confirm those of Krause et al. (2017), who estimated genetic divergence in seeds of 61 guava (Psidium guajava L.) genotypes based on 135 morphological variables (color, texture, and geometry variables) using digital phenotyping and found that 30% of the variables (9 color, 12 geometry, and 6 texture variables) were sufficient to estimate genetic variability, and they could even be reduced to 10% (3 color, 4 geometry, and 2 texture variables).
The greatest genetic distance was found between groups II and III (Table 3). This distance indicates possible crosses between FSF of these groups. When seeking for genetic divergence among populations, a high percentage of similar genotypes reduce the possibility of obtaining interpopulation hybrids. Thus, the choice of populations of groups that present greater divergences can be used in the searching for contrasting crosses, exploring the heterosis.
The first two canonical variables should estimate at least 80% of the total variation in the set of descriptors for a satisfactory interpretation of the genetic variability among the FSF. Therefore, the variability among the FSF can be explained satisfactory in a two-dimensional dispersion plot (Cruz et al., 2012), since the first two canonical variables explained 100% of the total variance of the analyzed descriptors (Figure 2). Paiva et al. (2014) evaluated the genetic diversity of 11 Passiflora species and found that the first two canonical variables explained 91.16% of the total variance, with CV1 explaining 80.30%, and CV2 explaining 10.86%, presenting a satisfactory two-dimensional graphical representation.
The geometry descriptor set contributed the most to quantify genetic divergence among the FSF, followed by the color, texture, and physiological descriptor sets (Table 2). These results were similar to those of Krause et al. (2017), who found that the seed geometry variable set contributed the most to quantify genetic divergence among guava genotypes. The five descriptors that contributed the most to quantify genetic divergence were those related to seed geometry—contour irregularity, contour convexity, thinning, circularity by shape factor, and circularity by FFCm. The characteristics related to seed shape were important to quantify genetic divergence among the FSF.
The contribution of the seed geometry descriptors denotes a possible correlation between morphological and physiological descriptors. This correlation was explained by Lurstwut and Pornpanomchai (2017), who analyzed digital images to evaluate germination of rice (Oryza sativa L.) seeds and found that the seed geometry (shape) characteristics presented greater reliability to evaluate seed germination than the other evaluated characteristics (color, and texture), because the image analysis system detect seeds that present irregular shape—broken or malformed seeds, for example—with greater precision; and damages that are identified by seed geometry cause more losses in seed batches. These authors also point out that color-related characteristics can detect seed aging and seed contamination with fungi, and texture-related characteristics can detect cracked seeds and fungus contamination, which considerably increases the accuracy rate of analyses (Lurstwut and Pornpanomchai, 2017)
According to the means of physiological descriptors (Table 4), group III presented larger seeds, higher and faster germination rate, and better seedling development in the field because of their higher SDW (4.140), RL (6.30), GSI (2.503), and SGP (90.00). High-vigor seeds are associated with greater seed weights because they present high caloric and protein content. Large seeds tend to have greater germinative power because they are better nourished, resulting in a better establishment of the seedlings in the field (Snider et al., 2016).
Seedlings with rapid germination and more vigorous growth, as found in group III, tend to result in plants with better establishment in the field, but with increased period of exposure to diseases, and susceptibility to pests in the first stages of development (Elliott et al., 2008; Liu et al., 2015; Snider and Oosterhuis, 2015). However, seedlings of the group II presented the best results of ESI (1.106), and SEP (0.658), i.e., they had a better emergence performance (speed and rate) in field conditions. Thus, crosses between FSF of groups II and III are viable alternatives to improve seed characteristics.
Conclusion
The Ward-MLM method was efficient in quantify genetic divergence among full-sibling families (FSF) of passion fruit by using seed morphological and physiological variables, simultaneously. The seed geometry-related descriptor set contributed the most to quantify genetic divergence among FSF of passion fruit, especially contour irregularity, contour convexity, thinning, circularity by shape factor, and circularity by FFCm. The formation of three heterotic groups by the Ward-MLM method denotes a genetic variability that can be explored. Crosses between FSF of groups II and III are viable alternatives to improve passion fruit seed characteristics.
Acknowledgment
The authors thank the Foundation for Research Support of the State of Mato Grosso (FAPEMAT) for funding this research and granting a scholarship to the first author.
About the Authors
Corresponding Author
Leandro Rafael Fachi
Agro-Environmental Research, Study, and Development Center, State University of Mato Grosso, MT358, Jardim Aeroporto, 78300-000, Tangará da Serra, MT, Brazil
- Email:
- leandrofachi@hotmail.com
References
- Bishaw Z, Niane AA, Gan Y (2007) Quality seed production. Lentil Springer 349-383. https://doi.org/10.1007/978-1-4020-6313-8_21
- Boelt B, Shrestha S, Salimi Z, Jørgensen J, et al. (2018) Multispectral imaging – A new tool in seed quality assessment? Seed Science Research 28: 222 to 228. https://doi.org/10.1017/s0960258518000235
- Brasil (2009) Ministério da Agricultura e da Reforma Agrária. Regras para análise de sementes Brasília: SNDA 395.
- Bundock P (2017) PF15000 National passionfruit breeding program. The Passion Vine.
- Cavalcante NR, Krause W, Viana AP, Silva CA, et al. (2017) Anticipated selection for intrapopulation breeding of passion fruit. Acta Scientiarum-Agronomy 39:143-148. https://doi.org/10.4025/actasciagron.v39i2.31022
- Crossa J and Franco J (2004) Statistical methods for classifying genotypes. Euphytica 137: 19-37. https://doi.org/10.1023/b:euph.0000040500.86428.e8
- Cruz CD, Carneiro PSC, Regazzi AJ (2014) Modelos biométricos aplicados ao melhoramento genético. UFV 668.
- Dell’aquila A (2009) Digital imaging information technology applied to seed germination testing. A review. Agronomy Sustainable Development 29: 213-221. https://doi.org/10.1051/agro:2008039
- Elliott RH, Franke C, Rakow GFW (2008) Effects of seed size and seed weight on seedling establishment, vigour and tolerance of Argentine canola (Brassica napus) to flea beetles, Phyllotreta spp. Can J Plant Science 88: 207-217. https://doi.org/10.4141/cjps07059
- Fao (2016) OCDE – FAO Perspectivas Agrícolas 2016-2025. OCDE-FAO Perspectivas Agrícolas. https://doi.org/10.1787/agr_outlook-2016-es
- Fiorani F and Schurr U (2013) Future scenarios for plant phenotyping. Annual Review of Plant Biology 64: 267-291. https://doi.org/10.1146/annurev-arplant-050312-120137
- Franco J, Crossa J, Villaseñor J, Taba S, et al. (1998) Classifying genetic resources by categorical and continuous variables. Crop Science 38: 1688-1696. https://doi.org/10.2135/cropsci1998.0011183x003800060045x
- Gonçalves LSA, Rodrigues R, Amaral Júnior AT, Karasawa M, et al. (2009) Heirloom tomato gene bank: assessing genetic divergence based on morphological, agronomic and molecular data using Ward-modified location model. Genetics and Molecular Research 8: 364-374. https://doi.org/10.4238/vol8-1gmr549
- Gower JC (1971) A general coefficient of similarity and some of its properties. Biometrics 27: 857-874. https://doi.org/10.2307/2528823
- Hadas A (1976) Water uptake and germination of leguminous seeds under changing external water potential in osmotic solution. Journal of Experimental Botany 27: 480-489. https://doi.org/10.1093/jxb/27.3.480
- IBGE - Instituto Brasileiro de Geografia e Estatística. (2016) Quantidade produzida, valor da produção, área plantada e área colhida da lavoura permanente no ano de.
- Krause W, Viana AP, Cavalcante NR, Ambrósio M, et al. (2017) Digital phenotyping for quantification of genetic diversity in inbred guava (Psidium guajava) families. Genetics and Molecular Research 16. https://doi.org/10.4238/gmr16019474
- Liu S, Remley M, Bourland FM, Nichols RL, et al. (2015) Early vigor of advanced breeding lines and modern cotton cultivars. Crop Science. 55: 1729-1740. https://doi.org/10.2135/cropsci2014.10.0686
- Lurstwut B and Pornpanomchai C (2017) Image analysis based on color, shape and texture for rice seed (Oryza sativa L.) germination evaluation. Agriculture and Natural Resources 51: 383-389. https://doi.org/10.1016/j.anres.2017.12.002
- Mccarthy A and Dick J (2017) ‘Passionfruit culture’. Farmnote. Department of Agriculture Western Australia.
- Maguire JD (1962) Speed of germination aid in selection and evaluation for seedling emergence and vigor. Crop Science 2: 176-177. https://doi.org/10.2135/cropsci1962.0011183x000200020033x
- Ocampo J, Arias JC, Ureea R (2016) Interspecific hybridization between cultivated and wild species of genus Passiflora L. Euphytica 209: 395-408. https://doi.org/10.1007/s10681-016-1647-9
- Oliveira AB, Lopes MMA, Moura CFH, Oliveira LS, et al. (2017) Effects of organic vs. conventional farming systems on quality and antioxidant metabolism of passion fruit during maturation. Scientia Horticulturae 222: 84-89. https://doi.org/10.1016/j.scienta.2017.05.021
- Paiva CL, Viana AP, Santos EA, Silva RNO, et al. (2014) Diversidade genética de espécies do gênero Passiflora com o uso da estratégia Ward -MLM, Revista Brasileira de Fruticultura 36: 381-390. https://doi.org/10.1590/0100-2945-156/13
- Popinigis F (1977) Fisiologia da semente. Brasília, DF: AGIPLAN.
- Santos EA, Viana AP, Freitas JCO, Souza MM, et al. (2014) Phenotyping of Passiflora edulis, P. setacea, and their hybrids by a multivariate approach. Genetics and Molecular Research 13: 9828-9845. https://doi.org/10.4238/2014.november.27.10
- Introduction to SAS (2009) SAS and R. 243-260. https://doi.org/10.1201/9781420070590.axa
- Schotsmans WC and Fischer G (2011) Passion fruit (Passiflora edulis Sim.). In: Postharvest Biology and Technology of Tropical and Subtropical Fruits 125-142. https://doi.org/10.1533/9780857092618.125
- Silva FHLE, Viana AP, Freitas JCO, Santos EA, et al. (2017) Prediction of genetic gains by selection indexes and REML/BLUP methodology in a population of sour passion fruit under recurrent selection. Acta scientiarum-agronomy 39: 183-190. https://doi.org/10.4025/actasciagron.v39i2.32554
- Silva SM, Oliveira RC, Almeida RF, Sá Júnior A (2015) Aryl removal methods and passion fruit seed positions: Germination and emergence. Journal of Seed Science 37: 125-130. https://doi.org/10.1590/2317-1545v37n2146373
- Snider, JL, Oosterhuis DM (2015) Physiology. Cotton 339-400. https://doi.org/10.2134/agronmonogr57.2013.0044
- Snider JL, Collins GD, Whitaker J, Chapman KD, et al. (2016) The impact of seed size and chemical composition on seedling vigor, yield, and fiber quality of cotton in five production environments. Field Crops Research 193:186-195. https://doi.org/10.1016/j.fcr.2016.05.002
- Sudhakar P, Latha P, Reddy PV (2016) Seed physiological and biochemical traits. Phenotyping Crop Plants for Physiological and Biochemical Traits 17-24. https://doi.org/10.1016/b978-0-12-804073-7.00002-8
- Tal Y, Anavi S, Reisman M, Samach A, et al. (2016) The neuroprotective properties of a novel variety of passion fruit. Journal of Functional Foods 23: 259-369. https://doi.org/10.1016/j.jff.2016.02.039
- Viana AP and Resende MDV (2014) Genética quantitativa no melhoramento de fruteiras. Rio de Janeiro: Interciencia 296.
- Ward J (1963) Hierarchical grouping to optimize an objective function. Journal of American Statistical Association 58: 236-244. https://doi.org/10.1080/01621459.1963.10500845
- Yang L and Wen B (2016) Quality Seed. Encyclopedia of Applied Plant Sciences.553-563. https://doi.org/10.1016/b978-0-12-394807-6.00205-7
Keywords:
Download:
Full PDF- Share This