Water stress adaptation of popcorn roots and association with agronomic traits
Received: July 11, 2018
Accepted: August 17, 2018
Published: August 27, 2018
Genet.Mol.Res. 17(3): http://dx.doi.org/gmr18078
DOI: http://dx.doi.org/10.4238/gmr18078
Abstract
Water stress reduces the yield of agricultural crops severely. The objectives of this study were to investigate genotypic differences between 20 popcorn lines in environments under wellirrigated (WW) and water stressed (WS) conditions to determine phenotypic, genetic and environmental relations among agronomic and root traits. The experiment was arranged in a randomized complete block design with three replications per environment. The following traits were evaluated: volume of expanded popcorn per hectare (PV), grain yield (GY), popping expansion (PE), number of rings of adventitious roots (NRAR), number of adventitious roots (NAR), number of tap roots (NTR), number of crown roots (NCR), adventitious root density (ARD), tap root density (TRD), crown root density (CRD), tap root angle (TRA), and crown root angle (CRA). Under WS, the values of the agronomic traits PV, GY and PE were reduced by 74.03, 67.15 and 28.76%, respectively. Water stress had little influence on NRAR, NAR, DR, NTR, and NCR. Due to an adaptive response to WS, increases were observed in TRA and CRA. In general, the estimates of genetic parameters evaluated under WS were higher. Negative genetic associations between agronomic traits and TRD, and CRD were observed in cultivation under WS; selection for trait PV will produce simultaneous gains in GY and PE under this regime. Under well-watered conditions, the development of genotypes with satisfactory GY and PE is difficult. This reinforces the hypothesis that root phenotypes adapted to particular environments should be identified.
Introduction
Abiotic stresses have a negative influence on the life cycle of a plant, preventing expression of the full genetic potential of agricultural crops (Dalal& Sharma 2017). In this sense, the yield reduction of agronomically important crops under WS is drastic (Cairns et al., 2012; Adebayo et al., 2014; Mageto et al., 2017). The current scenario of climate change is a matter of concern, given the forecast of an increasingly poor temporal and spatial distribution of resources, which will be associated with temperature increases, promoting an even more harmful synergy (Zandalinas et al., 2018).
Water restriction reduces the supply of agricultural products and, in association with the increasing global demand for food (estimate of 9.6 billion inhabitants in 2050), can result in severe worldwide food shortages (Fedoroff, 2015), with strong impacts on the price of commodities. Plant breeders provide cultivars with high grain yield potential for the grain market; however they are adapted to and dependent on an ideal water supply. Water-stress adapted popcorn cultivars are not currently known, indicating a current restriction to cultivars that depend on abundant water resources.
For popcorn breeding, with a particular focus on water stress tolerance, two main traits are useful for the market; these being grain yield (GY) and popping expansion (PE). However, genetic correlation between these two traits is negative (de Lima et al., 2016; do Amaral Júnior et al., 2016; Schwantes et al., 2018), hampering indirect selection and simultaneous gains. To overcome this difficulty, some researchers have been using the trait expanded popcorn volume per hectare - PV (product of the mean grain yield per plot by the mean expansion capacity (de Lima et al., 2016; do Amaral Júnior et al., 2016). According to Amaral Júnior et al. (2016),selection for PV makes mutual gains in GY and PE possible. However, under WS, the associations of PV with GY and PE as well as associations between the latter two traits are unknown.
Agricultural productivity depends on a good architectural structure of the root system, particularly in the case of environmental restrictions related to the soil, be it in terms of water or nutrients (Lynch, 1995). Adaptation of the root system to particular conditions of a biotic stress of soil represents an agronomic advantage (Lynch, 1995; Trachsel et al., 2011). In this context, it is worth mentioning the improved agronomic performance of field corn genotypes with a shallower root system (smaller angles in relation to the soil surface), since P availability is typically higher in the top soil layers (Zhu et al., 2005). On the other hand, water availability is greater in deeper layers, and under water stress, corn genotypes that have an axial, branched and deep root system can access this reserve (Gao & Lynch, 2016). In any case, an evaluation of the root architecture under field conditions is a time-consuming and difficult task; however, it is fundamental for breeding programs and imperative for quantitative genetics studies (Trachsel et al., 2011).
Identification and understanding of root phenotypes associated with higher PV, GY and PE values in popcorn genotypes can provide information serving as a guideline in breeding programs targeting better adapted root forms, especially underwater stress. The hypothesis that the rooting depth of maize genotypes with a lower number of crown roots is deeper under WS was tested and proved by Gao and Lynch (2016), showing that a lower number of crown roots improves water uptake from deeper soil layers, improving the water conditions of the plants and consequently crop growth and yield. For maize, Zhan et al. (2015) tested and proved the hypothesis that a reduction in the root branching density improves drought tolerance, by reducing the metabolic costs of soil exploitation, allowing an increased rooting depth and water uptake. However, there are no reports that shed light on the root phenotypes of popcorn in response to WS and WW.
For breeding of water-stress adapted popcorn, the genetic variability of the crop must be exploited and the intensity of associations between the plant shoot traits that favor the selection of root traits examined. The objective of this study was to investigate genotypic differences in a set of popcorn lines under contrasting water availability levels, as well as to estimate genetic parameters and phenotypic, genotypic and environmental correlations among agronomic and root traits.
Materials and Methods
Plant Material
Twenty popcorn lines (S7) with distinct climate adaptations, of the Active Germplasm Bank of the Universidade Estadual do Norte Fluminense Darcy Ribeiro (UENF), were evaluated. Of these, the lines derived from population 'BRS-Angela (L61, L63, L65, L69, L70, and L71) have tropical germplasm, while those derived from the commercial hybrid 'PJ' (P1, P5, P6 and P7); compound 'CMS-42' (P2 and P3); from South American races (P4); the commercial hybrid 'IAC-112' (P8 and P9); population 'Beija-Flor' (L54, L55 and L59); and from population 'Campinas' (L75 and L76) have temperate tropical germplasm.
The lines were separated into two maturation groups with 10 genotypes each (early - L54, L59, P2, P3, P4, P5, P6, P7, P8, and P9 and late- L55, L61, L63, L65, L69, L70, L71, L75, L76, and P1), based on the date of male anthesis recorded in previous trials. To synchronize the phenological stage of male flowering, staggered sowing was performed (first sowing, late genotypes - April 19, second sowing, early genotypes - April 25), in 2016.
Experimental design and cultural practices
The experiments were carried out in the dry season, from April to August, at the Experimental Station of the Colégio Estadual Agricultural Antônio Sarlo, in Campos dos Goytacazes, Rio de Janeiro, Brazil. The experiment was arranged in a randomized complete block design with three replications per environment, i.e., under well-watered (WW) conditions and water stress (WS). Each plot consisted of four 4.4-m rows, at a spacing of 0.20 m between plants and 0.80 m between rows. An area of7.04 m2 of the central rows of each plot was evaluated. Sowing fertilization of the experiments consisted of 30 kg N ha-1 (in the form of urea), 60 kg P2O5 ha-1(triple superphosphate) and 60 kg K2O ha-1 (potassium chloride). Side dressing was applied 30 days after sowing, staggered as described above, consisting of 100 kg N ha-1 (in the form of urea).
Irrigation was applied according to the different water regimes, with a trickle irrigation system, in which one dripper per plant was installed, at a spacing of 0.20 m. To ensure water stress, irrigation was suspended at the phenological stage of preflowering, exactly 15 days before male flowering (June 10, 2016).
The irrigation system was equipped with water meters that accurately measured the available water volume. The well-irrigated (WW) environment was watered with 138 mm, while 60 mm were applied in the WS environment. An automatic weather station of the Brazilian institute of meteorology (INMET) adjacent to the experimental area recorded 133 mm of rain during the whole experimental period. In the grain filling stage, irrigation was temporarily suspended for a period of 30 days in the WS experiment. The environmental conditions during the entire crop growth and development cycle were measured, recording the temperature (12 - 37°C), relative air humidity (23 - 97%)and mean solar radiation (20.35 MJ m-2day-1).
Evaluated traits
The grain yield (GY) was measured after threshing all ears of the evaluated plot area. The grain weight was corrected to 13% moisture and expressed in kg.ha-1. Popping expansion (PE) wasassessedin30 g grain samples, by heating in paper bags in a microwave oven, at 1,000 W, for 2 min and 15 sec. The popcorn volume was quantified in a 2,000 mL graduated beaker. Popping expansion was determined as the ratio of popcorn volume by grain weight (mL.g-1). The volume of expanded popcorn per hectare (PV) was estimated by multiplying GY by PE, to compute the mean expanded popcorn volume per hectare, expressed in m3.ha-1.
The measurements of the root traits were performed according to the methodology proposed by Trachsel et al. (2011), with modifications. After harvesting the plant shoots, the soil of the WW and WS environments was irrigated with 50 mm of water, facilitating the mechanical removal of the plant root systems with conventional shovels. The root system of two plants per plot and genotype in both environments was extracted in a soil cylinder (diameter 40 cm, depth 25 cm). These cones were washed with water until total removal of the substrate.
The following root traits were evaluated: number of rings of adventitious roots (NRAR), number of adventitious roots (NAR), number of tap roots(NTR), number of crown roots(NCR) - determined by counting; adventitious root density (ARD); tap root density (TRD), crown root density (CRD) –determined on the scale proposed by Trachsel et al. (2011);tap root angle(TRA) and crown root angle(CRA) –measured with a protractor and expressed in degrees (°) in relation to the soil surface. The results were consolidated with the supplementary material proposed by Trachsel et al. (2011) for high-throughput phenotyping of root architecture.
Statistical analyses
Analysis of variance was performed according to the following statistical
model: 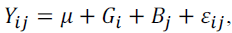 where Yij is the observation of the i-th genotype of the jth
block; μ the overall constant; Gi the treatment effect; Bj the block effect; and ��ij the
experimental error.
where Yij is the observation of the i-th genotype of the jth
block; μ the overall constant; Gi the treatment effect; Bj the block effect; and ��ij the
experimental error.
The following genetic parameters were estimated: experimental variation
coefficient 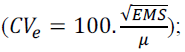 phenotypic variance
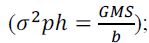 environmental
variance
environmental
variance 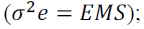 genotypic variance
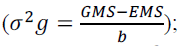 genotypic determination
coefficient
genotypic determination
coefficient 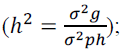 intraclass coefficient
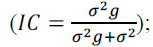 genotypic variation
coefficient
genotypic variation
coefficient 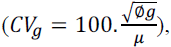 and variation index
The phenotypic  genotypic (rg) and environmental correlation coefficients
(re) were calculated by:
genotypic (rg) and environmental correlation coefficients
(re) were calculated by:  where:
 correspond, respectively, to the phenotypic,
genotypic and environmental covariances between the traits x and y;
correspond, respectively, to the phenotypic,
genotypic and environmental covariances between the traits x and y;  and
and correspond to the phenotypic, genotypic and environmental variance of trait x; and
  correspond, respectively, to the genotypic, phenotypic and
environmental variance of trait y. Significance of the phenotypic (rph), genotypic (rg)
and environmental correlation coefficients (re) was evaluated by the t test, at 5% and
1% significance.
correspond, respectively, to the genotypic, phenotypic and
environmental variance of trait y. Significance of the phenotypic (rph), genotypic (rg)
and environmental correlation coefficients (re) was evaluated by the t test, at 5% and
1% significance.
Results
Genetic and environmental effects on agronomic and root traits in popcorn
Significant genetic variability was detected among the genotypes evaluated in environments WS and WW for the agronomic traits PV, GY and PEt (Table 1; F test at 1% probability). The coefficient of experimental variation (CVe) was less than 30% for these traits, indicating a satisfactory level of experimental accuracy. Moreover, the CVe values were lower in the WS environment.
| Trait | Water regime | MS | Trait | ||
| Block (DF=2) | Genotype (GL=19) | Residue (GL=38) | |||
| VP | WS | 74.18 | 314.53** | 33.03 | 23.63 |
| WW | 568.09 | 1.431.19** | 397.72 | 26.94 | |
| GY | WS | 137.418.51 | 559.525.58** | 66.624.41 | 22.66 |
| WW | 601.287.53 | 1.839.610.00** | 336.794.59 | 22.70 | |
| PE | WS | 2.76 | 36.40** | 3.35 | 8.75 |
| WW | 2.53 | 52.27** | 16.40 | 13.80 | |
| NRAR | WS | 0.18 | 0.16 | 0.12 | 25.74 |
| WW | 0.27 | 0.47** | 0.15 | 27.67 | |
| NAR | WS | 4.32 | 3.90 | 3.94 | 17.54 |
| WW | 1.59 | 8.36** | 2.95 | 14.75 | |
| ARD | WS | 0.46 | 3.64** | 1.24 | 17.87 |
| WW | 0.59 | 3.94** | 1.58 | 20.63 | |
| NTR | WS | 1.38 | 6.07 | 3.32 | 19.31 |
| WW | 0.33 | 3.91 | 2.61 | 18.07 | |
| TRA | WS | 44.48 | 48.98 | 33.57 | 11.64 |
| WW | 18.44 | 178.72** | 64.97 | 21.22 | |
| TRD | WS | 0.24 | 3.55** | 0.73 | 14.31 |
| WW | 0.54 | 3.51** | 1.44 | 22.99 | |
| NCR | WS | 18.72 | 14.32* | 6.90 | 16.00 |
| WW | 2.92 | 7.53 | 5.78 | 15.43 | |
| CRA | WS | 67.81 | 43.60 | 40.37 | 11.97 |
| WW | 19.98 | 136.85** | 54.92 | 17.36 | |
| CRD | WS | 0.30 | 3.05** | 0.97 | 17.46 |
| WW | 2.10 | 1.78 | 1.25 | 26.20 | |
WS: Water stress; WW: Well-watered; MS: mean square; DF: degrees of freedom; CVe: coefficient of variation. PV: expanded popcorn volume per hectare; GY: grain yield; PE: popping expansion; NRAR: number of rings of adventitious roots; NAR: number of adventitious roots; ARD: density of adventitious roots; NTR: number of tap roots; TRA: tap root angle; TRD: tap root density; NCR: number of crown roots; CRA: crown root angle; CRD: crown root density.* and **: significant at 5.0 % and 1.0 % probability by the F test, respectively.
Table 1. Summary of analysis of variance and coefficients of environmental variation (CVe), of agronomic and architectural root traits in popcorn lines under water stress (WS) and well-irrigated conditions (WW).
For the root traits ARD, TRD, NCR, and CRD, under WS, and for NRAR, NAR,ARD, TRA, TRD, and CRA under WW conditions there were significant differences (Table 1; F test). The CVe values for root traits ranged from 11.64% (TRA - WS) to 27.67 % (NRAR - WW) % (Table 1) and were mostly lower under WS.
Means, proportional performance decrease in response to water stress and genetic parameters of agronomic and root traits of popcorn under WS and WW conditions
The mean PV under WS was 24.32 m3.ha-1and 74.03 m3.ha-1under WW conditions
(Table 2). The percentage difference between the environments for this trait was 67.15
(Figure 1). Under WS, GY was 55.30 % lower than in the WW environment (Figure 1), i.e.,
with a mean GY under WS of 1139.11 kg.ha-1 and 2548.08 kg.ha-1 in the WW environment
(Table 2). The popping expansion capacity under WS was 20.91 mL.g-1 and under WW
conditions, 29.35 mL.g-1 (Table 2), i.e., WS caused a reduction of 8.76% (Figure 1). A
comparison of the genetic  and environmental variance
 showed that the former
was higher for PV, GY and PE, under both water regimes (Table 2).
showed that the former
was higher for PV, GY and PE, under both water regimes (Table 2).

Figure 1. Differences between the relative mean percentages of agronomic and root traits evaluated in popcorn lines under water stress (WS) compared to the performance in a well-watered evnirvoirnonment ent (WW).
| Traits | W. Reg. | Means | σ2ph | σ2e | σ2g | h2 | CI | CVg | Iv |
| V P | WS | 24.32 | 104.84 | 11.01 | 93 .83 | 89.50 | 73.96 | 39.83 | 1.69 |
| WW | 74.03 | 477.06 | 132.57 | 34 4.49 | 72.21 | 46.41 | 25.07 | 0.93 | |
| G Y | WS | 1139.1 | 186508.5 | 22208.1 | 16 4300.4 | 88.09 | 71.15 | 35.58 | 1.57 |
| WW | 2548.1 | 613203.3 | 112264.9 | 50 0938.5 | 81.69 | 59.80 | 27.78 | 1.22 | |
| C E | WS | 20.91 | 12.13 | 1.12 | 11 .02 | 90.79 | 76.67 | 15.87 | 1.81 |
| WW | 29.35 | 17.42 | 5.47 | 11 .96 | 68.63 | 42.17 | 11.78 | 0.85 | |
| N ARA | WS | 1.33 | 0.05 | 0.04 | 0.0 1 | 25.42 | 10.20 | 8.67 | 0.34 |
| WW | 1.39 | 0.16 | 0.05 | 0.1 1 | 68.28 | 41.77 | 23.43 | 0.85 | |
| N RA | WS | 11.32 | 1.30 | 1.31 | 0.0 0 | 0.00 | 0.00 | 0.00 | 0.00 |
| WW | 11.65 | 2.79 | 0.98 | 1.8 0 | 64.69 | 37.91 | 11.52 | 0.78 | |
| D RA | WS | 6.24 | 1.21 | 0.41 | 0.8 0 | 65.85 | 39.13 | 14.32 | 0.80 |
| WW | 6.09 | 1.31 | 0.53 | 0.7 9 | 59.91 | 33.25 | 14.56 | 0.71 | |
| N RS | WS | 9.43 | 2.02 | 1.11 | 0.9 2 | 45.37 | 21.68 | 10.16 | 0.53 |
| WW | 8.94 | 1.30 | 0.87 | 0.4 3 | 33.18 | 14.20 | 7.35 | 0.41 | |
| A RS | WS | 49.78 | 16.33 | 11.19 | 5.1 4 | 31.47 | 13.28 | 4.55 | 0.39 |
| WW | 37.98 | 59.57 | 21.66 | 37 .92 | 63.65 | 36.85 | 16.21 | 0.76 | |
| D RS | WS | 5.96 | 1.18 | 0.24 | 0.9 4 | 79.50 | 56.39 | 16.27 | 1.14 |
| WW | 5.22 | 1.17 | 0.48 | 0.6 9 | 59.05 | 32.46 | 15.94 | 0.69 | |
| N RC | WS | 16.42 | 4.77 | 2.30 | 2.4 7 | 51.84 | 26.41 | 9.58 | 0.60 |
| WW | 15.58 | 2.51 | 1.93 | 0.5 8 | 23.24 | 9.17 | 4.90 | 0.32 | |
| A RC | WS | 53.06 | 14.53 | 13.46 | 1.0 8 | 7.40 | 2.60 | 1.95 | 0.16 |
| WW | 42.67 | 45.62 | 18.31 | 27 .31 | 59.87 | 33.21 | 12.25 | 0.71 | |
| D RC | WS | 5.65 | 1.02 | 0.32 | 0.6 9 | 68.11 | 41.59 | 14.73 | 0.84 |
| WW | 4.19 | 0.59 | 0.42 | 0.1 7 | 29.48 | 12.23 | 9.97 | 0.37 |
W.Reg.: Water regi me; WS: Water stress; WW: Well- watered; σ2ph: phenotypic variance; σ2e: environmenta l variance; σ2g : Genetic variance; CI: intraclass correlation coefficient; CVg: coefficient of genetic varia tion; Iv: variation index; PV:exp anded popcorn volume per hectar e (m3.ha-1); GY: grain yield (Kg.h a-1); PE: popping expansion (mL.g-1); NRAR: nu mber of rings of a dventitious roots; NAR: number of adventitious roots; ARD: density of adventitious roots; NTR: nu mber of tap roots; TRA: tap root a ngle (º); TRD: tap root density; NC R: number of cr own roots; CRA: crown root ang le (º); CRD: crow n root density.
Table 2. Means, phenotypic (σ2ph), environmental (σ2e) and genetic variance (σ2g), heritability (h2), intraclass cor relation (CI), coefficient of gene tic variation (C Vg), and variatio n index (Iv) of agronomic and architectural roo t traits in popcorn lines under wa ter stress (WS) a nd well-irrigated conditions (WW).
The heritability estimates (h2) of agronomic traits ranged from 68.63 (PE-WW) to 90.79% (PE-WS) (Table 2). The h2 estimates of the traits PV, GY and PE were higher under WS (89.50, 88.09 and 90.79%, respectively) (Table 2). A lower influence of the WS environment on the genotypes was observed, since the intraclass correlation (IC) coefficients were higher under this condition (73.93, 71.15 and 76.67% for PV, GY and PE, respectively) (Table 2). The amplitude of genetic variation, expressed by the coefficient of genetic variation (CVg) was higher under WS (39.83, 35.83 and 15.87% for PV, GY and PE, respectively) (Table 2). The variation index (Iv), which is inadequate if it exceeds a unit, was only observed for the traits PV (0.93) and PE (0.85) under WW (Table 2).
The percentage differences between the environments were lowest for the traits related to adventitious roots (-4.32, -2,83 and 2.46% for the traits NRAR, NAR and ARD, respectively) (Figure 1). The means of NRAR, NAR and ARD, were 1.33, 11.32 and 6.24 under WSand1.39, 11.65 and 6.09 under WW, respectively (Table 2). For the genetic (σ2g)and environmental variance (σ2e) of the above traits, the first was higher than the second for NRAR and NAR under WW conditions, and for ARD under both water regimes (Table 2).
The estimates of genetic parameters for NAR indicated a higher value of the residual variance component than of phenotypic variance; this resulted in negative values for the subsequent parameters, impairing their calculation. This can be attributed to the high environmental influence affecting this trait.
Heritability estimates (h2) for the other traits related to adventitious roots ranged from 25.42 (NRAR - WS) to 68.25% (NRAR-WW) (Table 2). The h2estimates for ARD had a similar pattern between the environments WS (65.85%) and WW (59.91%), as well as their intraclass correlation coefficients (IC) and coefficient of genetic variation (CVg) (Table 2). The variation index (Iv) was lower than a unit for all adventitious root traits (Table 2).
For the tap-root related traits NTR, TRA and TRD, analyzed under WS, percentage increases in relation to the control (WW)environment of 5.48, 31.47 and 14.48%, respectively, were observed (Figure 1). In absolute values, this corresponds to a number of tap roots of 9.48, a tap root angle of 49.78° and tap root density of 5.96 units under WS, compared to, in the same trait order as above, 8.94, 37.98 and 5.22, respectively (Table 2). The environmental variance (σ2e) was higher than the genetic variance (σ2g) for NTR under both water regimes and for TRA under WS (Table 2).
Among the heritability estimates (h2) evaluated in tap root traits, the highest TRD observed was 79.50% under WS and 59.05% under WW conditions (Table 2). The intraclass correlation estimates (IC) were lower than 40%, except for TRD (56.39) under WS (Table 2). The coefficients of genetic variation (CVg) were similar only for TRD (16.27% - WS; 15.94% - WW) (Table 2). Only for TRD, the variation index (Iv) exceeded a unit (1.14) under WS (Table 2).
The crown-root related traits NCR,CRA AND CRD performed better under WS than WW conditions, with the following percentage increases: 5.39, 24.35 and 34.84%, respectively (Figure 1). In the WS environment, the means of the traits NCR, CRA and CRD were 16.42, 53.06 and 5.65, respectively, and in the WW environment 15.58, 42.67 and 4.19, respectively (Table 2). The values of environmental variance (σ2e) were higher than those of genetic variance (σ2g) for NCR and CRD, under WW conditions and for CRA, under WS (Table 2).
The heritability estimates (h2) for crown root traits ranged from 7.40 (CRA) to 68.11% (CRD), both under WS (Table 2). The intraclass correlation coefficient (IC) and coefficient of genetic variation (CVg) were lower than 42 and 15%, respectively (Table 2). The values of the above parameters were highest for CRD, under WS. The variation index (Iv) was below a unit for all evaluated crown-root traits.
Phenotypic, genetic and environmental correlation coefficients among agronomic and root traits of popcorn under WW and WS
Under WS, the phenotypic (rph), genetic (rg) and environmental correlation coefficients (r) were significant (p< 0.01) for trait PV and positive for GY and PE (Table 3). Under the same water regime, the rph, rg and re of GY and PE followed the same pattern; however they were not significant (Table 3). In the WW environment, the estimates of rph, rg and re were significant (p< 0.01) and positive between PV x GY; however, for PE, only the re estimate was significant and in the same sense (Table 3). A significant (p < 0.05) and negative rg between GY x PE (-0.44) stood out (Table 3).
| Traits | W. Reg. / coefficients |
WS VP ** |
GY | PE | WW VP ** |
GY | PE |
| GY | rph | 0.92 | - | 0.85 | - | ||
| rg | 0.92** | - | 0.85** | - | |||
| re | 0.88** | - | - | 0.86** | - | - | |
| PE | rph | 0.66** | 0.32 | 0.24 | -0.30 | ||
| rg | 0.68** | 0.35 | - | 0.10 | -0.44* | - | |
| re | 0.50* | 0.09 | - | 0.56** | 0.11 | - | |
| NRAR | rph | -0.16 | -0.01 | -0.36 | -0.18 | -0.25 | 0.24 |
| rg | -0.31 | -0.05 | -0.67** | -0.20 | -0.30 | 0.43 | |
| re | -0.04 | 0.03 | -0.14 | -0.14 | -0.12 | -0.18 | |
| NAR | rph | 0.03 | 0.00 | 0.05 | 0.08 | 0.12 | -0.04 |
| rg | 0.00 | 0.00 | 0.00 | 0.10 | 0.11 | -0.05 | |
| re | -0.06 | -0.01 | -0.15 | 0.06 | 0.16 | -0.02 | |
| ARD | rph | -0.26 | -0.20 | -0.29 | -0.31 | -0.15 | -0.29 |
| rg | -0.35 | -0.29 | -0.33 | -0.45* | -0.13 | -0.58** | |
| re | 0.05 | 0.12 | -0.15 | -0.05 | -0.21 | 0.23 | |
| NTR | rph | 0.19 | -0.03 | 0.57** | 0.08 | 0.21 | -0.24 |
| rg | 0.27 | -0.05 | 0.86** | 0.15 | 0.38 | -0.55** | |
| re | 0.06 | -0.01 | 0.09 | 0.01 | 0.02 | 0.06 | |
| TRA | rph | -0.18 | -0.31 | 0.15 | -0.09 | -0.05 | -0.01 |
| rg | -0.27 | -0.59** | 0.39 | -0.24 | -0.14 | -0.04 | |
| re | -0.15 | 0.01 | -0.22 | 0.22 | 0.19 | 0.03 | |
| TRD | rph | -0.35 | -0.35 | -0.19 | -0.11 | -0.04 | -0.17 |
| rg | -0.42 | -0.43 | -0.22 | -0.02 | 0.06 | -0.30 | |
| re | 0.05 | 0.03 | -0.01 | -0.27 | -0.29 | 0.07 | |
| NCR | rph | 0.01 | 0.01 | 0.05 | -0.29 | -0.01 | -0.41 |
| rg | 0.01 | 0.02 | 0.07 | -0.92** | -0.32 | -0.99** | |
| re | 0.02 | -0.01 | -0.01 | 0.19 | 0.33 | -0.03 | |
| CRA | rph | -0.16 | -0.31 | 0.20 | -0.19 | -0.12 | -0.07 |
| rg | -0.51** | -0.99** | 0.92** | -0.31 | -0.20 | -0.11 | |
| re | -0.11 | -0.02 | -0.15 | 0.05 | 0.07 | 0.01 | |
| CRD | rph | -0.34 | -0.28 | -0.30 | -0.08 | -0.10 | 0.02 |
| rg | -0.39 | -0.31 | -0.36 | -0.25 | -0.17 | -0.25 | |
| re | -0.20 | -0.19 | -0.12 | 0.07 | -0.04 | 0.28 |
**,* : significance at 1 % and 5 % probability by the t test, respectively. WW: well irrigated; WS: water stress; phenotypic correlation (rph); genotypic correlation (rg); and environmental correlation (re); PV: expanded popcorn volume per hectare; GY: grain yield; PE: popping expansion; NRAR: number of rings of adventitious roots; NAR: number of adventitious roots; ARD: density of adventitious roots; NTR: number of tap roots; TRA: tap root angle; TRD: tap root density; NCR: number of crown roots; CRA: crown root angle; CRD: crown root density.
Table 3. Estimates of phenotypic (rg), genotypic (rg) and environmental(re) correlation coefficients between agronomic and root traits measured in 20 popcorn lines under water stress (WS) and well-irrigated (WW) conditions.
The rph estimates between the traits measured in adventitious and agronomic roots were not significant for either water regime (Table 3). Significant and negative rg estimates were identified between PE x NRAR (-0.67) under WS, and between PV x DR (-0.45) and PE x DR (-0.58) under WW conditions (Table 3). Positive re estimates were observed between the combinations PV x ARD (0.05), GY x NRAR (0.03), GY x ARD (0.12) under WS; and between PE x ARD (0.23) under WW conditions (Table 3), demonstrating that the traits were benefited or affected by the same environmental variations.
The rph estimates measured between the agronomic and tap root traits were significant (p< 0.01) and positive for the combination PE x NTR (0.57) (Table 3). Under WS, the rg estimates were significant for the combinations TRA X GY (-0.59) and NTR x PE (0.86); and between PE x NR (-0.55)in the WW environment (Table 3). Under both water regimes, the rg estimates were mostly higher than rph and re, demonstrating the greater influence of genetic than environmental components on the linear association between these pairs of traits. The re estimates were not significant between the evaluated traits under either condition (Table 3).
The rph and re estimates measured between the crown root and agronomic traits were not significant (Table 3). The rg estimates were significant between the traits PV x CRA (-0.51), GY x CRA (-0.99) and PE x CRA (0.92) under WS; and between PV x NCR (-0,92) and PE x NCR (-0.99) in the WW environment (Table 3). The higher influence of the genetic component can be shown by the rg estimates, which were mostly higher than rph and re under both water regimes.
Discussion
Genetic variability was detected for the agronomic traits PV, GY and PE under WS and WW, as well as for the root traits, except for NRAR, NAR, NTR, and TRA under water stress (WS); and for NTR, NCR and CRD in the absence of water stress (WW). In both cases, it can be assumed that selection will promote genetic gains.
Water stress significantly reduced the values of the agronomic traits PV, GY and PE, by around 74.03, 67.15 and 28.76%, respectively. This environmental constraint resulted in severe restrictions in GY and yield components when the onset of WS in this study coincided with the phenological stages flowering and grain filling (Bolaños & Edmeades, 1996). Infield corn, WS can reduce grain yield (GY) by 17 to 80% (Bolaños & Edmeades, 1996). In maize lines and hybrids a mean GY reduction of 80% and 76%, respectively, was observed(Cairns et al., 2012). According to these authors, the GY reduction was related, to a large extent, with a decrease in the number of grains produced per unit of area (Cairns et al., 2012). Due to a lack of published studies on popcorn cultivation under water stress, no information was found on reduction of PV, GY and PE in popcorn genotypes under WS.
Adaptation of the root system of popcorn lines to WS can be observed in the increase of the traits TRA (31.07 %) and CRA (24.35 %). This means that to extract water, the roots tended to extend to the deeper layers (wider angles) in relation to the soil surface. For WS environments, Trachsel et al. (2011) claimed that genotypes with wider angles in relation to the soil are more advantageous for water uptake. According to Singh et al. (2010),plants with roots with steep angles (close to 90º in relation to the soil) will explore predominantly deeper soil layers.
The traits TRD (14.18%) and CRD (34.84%) were strongly influenced by WS, as shown by the increase observed in the comparison of the environments WS and WW. The greater relationship between root and shoot is considered an evolutionary mechanism of interest for adaptation to WS tolerance (Liu et al., 2011; Vaughan et al., 2015), which may explain the higher root density observed in this study. On the other hand, some authors believe that a reduction of root density of maize roots increases WS tolerance (Zhan et al., 2015).
The agronomic traits PV, GY and PE had higher genotypic determination coefficients (h2) under WS. The h2 explains the proportion of phenotypic variance of genetic nature, expressing the degree of correlation between the phenotype and genotype. This statement implies that selection of superior genotypes under WS can be maximized, providing higher genetic gains. The h2 estimates for root traits were low under both water regimes. According to Burton et al. (2013), the root system of maize plants has low heritability and high plasticity in response to different soil water conditions. According to Lynch (2015).Root traits normally have low heritability and frequently high plasticity in response to soil conditions, which is the reason why plant breeders rarely select for root traits. Root traits are less reliable in predicting the genotypic from the phenotypic value.
Higher values of the intraclass correlation coefficient (IC) were observed for agronomic traits under WS and strong environmental effects on root traits were found (lower IC). The IC represents the trend of maintaining the phenotypic superiority of genotypes, related to the degree of environmental influence on the genotypes. In this sense, the higher the intraclass correlation estimate, the lower is the environmental influence and the more precise the inferences about the traits will be. The chances of success with selection of agronomic traits under WS are good if the CVg values are high under this condition. The estimates of genetic variation coefficient provide breeders with information about the magnitude of genetic variation of a trait and indicate possible changes resulting from selection (Cruz et al., 2014).
Values of Iv above a unit were observed in the agronomic traits and TRD, mainly under WS. The Iv estimates are used to determine the chances of success with selection for a given trait, in terms of its magnitude, especially for situations in which the estimate is greater than or equal to a unit (Cruz et al., 2014). In this sense, simple selection methods can be used to obtain satisfactory gains.
Popcorn breeders can use the trait PV for simultaneous gains in GY and PE under WS, provided the genetic correlation (rg) effects between them are significant and positive. A positive association between GY and PE, even if the effect is not significant, allows conclusions about the possibility of mutual gains between the traits. Under WS, the magnitudes of rg exceeded those of rph and re, allowing the conclusion that the influence of genetic components on the linear association between the pairs of traits is greater than those of the environmental components (Cruz et al., 2014).
Breeding popcorn genotypes with high estimates of GY and PE under WW conditions is not an easy task. Under this environmental condition, negative and significant estimates between GY and PE have commonly been found (Freitas et al., 2014; de Lima et al., 2016; do Amaral Júnior et al., 2016). Negative genotypic correlations indicate that selection targeting gains in one trait will cause the opposite effect in another. The trait PV was incorporated as an alternative to obtain simultaneous gains between GY and PE, although this association cannot be confirmed. Therefore, in such cases selection indices can be used alternatively. There is strong environmental influence on the association between PV x GY and PV x PE if the re values are higher than those of rg, which allows the conclusion that there is no linear association between the pairs of traits.
Smaller angles of crown roots in relation to the soil were associated with higher PV, GY and PE under WS. Gao and Lynch (2016) proposed a root ideotype for field corn plants under WS, consisting of three main features: 'Steep, Cheap, and Deep'. “Steep” suggests plants with root angles close to 90º in relation to the soil, which is noted as an advantage for water uptake from deeper layers. Based on our results, we could not confirm the hypothesis of these authors. Research on the other traits in future studies is suggested, since using the methodology of this study, proposed by Trachselet al (2011), the other components of the proposed ideotype could not be analyzed.
Smaller angles of tap roots in relation to the soil were associated with a higher GY, which was also true for a lower number of rings of adventitious roots and greater number of tap roots under WS. Trachsel et al. (2011) described that in environments with limited water, genotypes with wider angles in relation to the soil have adaptive advantages to tap into water and increase grain yield. Our results contradicted the conclusions of Trachsel et al. (2011). For Lynch & Brown (2001), plants with shallow root angles will exploit predominantly surface soil layers. The relation of PE with these root traits is unknown.
Under WW conditions, a lower density of adventitious roots and lower number of crown roots were associated with higher PV and PE values, and exclusively, with a lower number of tap roots associated with higher PE. It was not possible to identify root traits associated with higher GY.
Negative associations were most frequent among agronomic traits and density of tap and crown roots under WS. Zhan et al. (2015) described a reduction in root branching density as a response to increased WS tolerance in field corn, since this strategy reduces the metabolic costs of soil exploitation, allowing deeper rooting depth and greater water uptake. According to Lambers et al. (2002), the metabolic cost of the root system for soil exploitation is high and can exceed the daily photosynthetic rate of a plant by 50%. Nevertheless, an increase in root density was observed in the WS environment over plants under WW conditions. However, the popcorn plants with lowest root density tended to be the most productive.
As contributions and conclusions for popcorn breeding, with a view to further increase GY and PE, especially under WS, the trait PV should be taken into consideration, as it is positively correlated with the former two traits. In this way, selection for PV can be indicated as a feasible option for correlated responses in indirect selection. Under WW conditions, a feasible option for simultaneous gains in GY and PE is the use of selection indices.
Measurement of root traits allowed description of the basic architecture of popcorn plants under field condition under WS and WW conditions. Field evaluations of root systems provide valuable data, since roots are exposed to the complex interaction of biotic and abiotic soil components and environmental conditions (Walter et al., 2009). The estimates of genetic parameters indicated a strong environmental influence on root traits. Thus, it was not possible to identify a relevant trait to explain the higher PV, GY and PE values under WS and WW conditions; however, we reinforce the need for identifying specific root phenotypes of each environment, which differ between WS and WW conditions. To make selection for agronomic traits of popcorn under WS more reliable, the lower density of tap and crown roots is worth being exploited. In the future, implementation of studies that investigate the pattern of root length and depth in genotypes of contrasting performance under WS is suggested, and the importance of generating information about the genetic control of root traits is highlighted.
CONCLUSIONS
Under water stress, selection for expanded popcorn volume per hectare is the best strategy to increase grain yield and popping expansion. Under WW conditions, however, the use of a selection index is a more reliable option to promote simultaneous increases in grain yield and popping expansion. There was an increase in TRA and CRA under WS, as an adaptive response to find water in the soil and consequently increase grain yield. However, it was not possible to identify the root trait that could explain the higher values of PV, GY and PE under WS and WW conditions. In any case, the hypothesis of a need for identifying phenotypes in each particular environment is reinforced, as a support for breeding programs.
Acknowledgments
The authors thank FAPER and CNPq for their financial support.
Conflicts of interest
The authors declare no conflict of interest.
About the Authors
Corresponding Author
S. H. Kamphorst
Laboratório de Melhoramento Genético Vegetal, Universidade Estadual do Norte Fluminense Darcy Ribeiro – Campos dos Goytacazes, RJ, Brasil
- Email:
- samuelkampho@hotmail.com
References
- Adebayo MA, Menkir A, Blay E, et al. (2014) Genetic analysis of drought tolerance in adapted × exotic crosses of maize inbred lines under managed stress conditions. Euphytica 196:261–270.
- Araki H, Hirayama M, Hirasawa H, Iijima M (2000) Which Roots Penetrate the Deepest in Rice and Maize Root Systems? Plant Prod Sci 3:281–288.
- Bolaños J, Edmeades GO (1996) The importance of the anthesis-silking interval in breeding for drought tolerance in tropical maize. F Crop Res 48:65–80.
- Burton AL, Brown KM, Lynch JP (2013) Phenotypic Diversity of Root Anatomical and Architectural Traits in Species.Crop Sci 53:1042.
- Cairns JE, Sanchez C, Vargas M, et al (2012) Dissecting Maize Productivity: Ideotypes Associated with Grain Yield under Drought Stress and Well-watered Conditions.J Integr Plant Biol 54:1007–1020.
- Cruz CD, Carneiro PCS, Regazzi AJ (2014) Modelos Biométricos Aplicados ao Melhoramento Genético - vol II. UFV, Viçosa
- Dalal M, Sharma TR (2017) Biotechnological Applications for Improvement of Drought Tolerance. In: Abiotic Stress Management for Resilient Agriculture. Springer Singapore, Singapore, pp 299–312
- de Lima VJ, do Amaral Junior AT, Kamphorst SH, et al (2016) Combining ability of S3 progenies for key agronomic traits in popcorn: comparison of testers in top-crosses. Genet Mol Res 15:1-14.
- doAmaralJúnior AT, dos Santos A, Gerhardt IFS, et al (2016) Proposal of a super trait for the optimum selection of popcorn progenies based on path analysis. Genet Mol Res 15:1–9.
- Fedoroff N V (2015) Food in a future of 10 billion.Agric Food Secur 4:11.
- Freitas ILJ, Amaral Jr AT, Freitas Jr SP, et al (2014) Genetic gains in the UENF-14 popcorn population with recurrent selection. Genet Mol Res 13:518–527
- Gao Y, Lynch JP (2016) Reduced crown root number improves water acquisition under water deficit stress in maize ( Zea mays L.). J Exp Bot 67:4545–4557.
- Lambers H, Atkin O, Millenaar F (2002) Respiratory Patterns in Roots in Relation to Their Functioning. In: Plant Roots. CRC Press, pp 521–552
- Liu Y, Subhash C, Yan J, et al (2011) Maize leaf temperature responses to drought : Thermal imaging and quantitative trait loci ( QTL ) mapping. Environ Exp Bot 71:158–165.
- Lynch J (1995) Root Architecture and Plant Productivity. Plant Physiol 109:7–13.
- Lynch JP (2007) Roots of the Second Green Revolution. Aust J Bot 55:493.
- Lynch JP (2015) Root phenes that reduce the metabolic costs of soil exploration: opportunities for 21st century agriculture. Plant Cell Environ 38:1775–1784.
- Lynch JP, Brown KM (2001) Topsoil foraging—an architectural adaptation of plants to low phosphorous availability.Plant Soil 237:225–237.
- Mageto EK, Makumbi D, Njoroge K, Nyankanga R (2017) Genetic analysis of early-maturing maize ( Zea Mays L.) inbred lines under stress and nonstress conditions. J Crop Improv 31:560–588.
- Schwantes IA, do AmaralJúnior AT, Vivas M, et al (2018) Inheritance of resistance to Fusarium ear rot in popcorn. Crop Breed ApplBiotechnol18:81-88.
- Singh V, van Oosterom EJ, Jordan DR, et al. (2010) Morphological and architectural development of root systems in sorghum and maize. Plant Soil 333:287–299.
- Trachsel S, Kaeppler SM, Brown KM, Lynch JP (2011) Shovelomics: high throughput phenotyping of maize (Zea mays L.) root architecture in the field. Plant Soil 341:75–87.
- Vaughan MM, Christensen S, Schmelz EA, et al. (2015) Accumulation of terpenoidphytoalexins in maize roots is associated with drought tolerance. Plant Cell Environ 38:2195–2207.
- Walk TC, Jaramillo R, Lynch JP (2006) Architectural Tradeoffs between Adventitious and Basal Roots for Phosphorus Acquisition. Plant Soil 279:347–366.
- Walter A, Silk WK, Schurr U (2009) Environmental Effects on Spatial and Temporal Patterns of Leaf and Root Growth. Annu Rev Plant Biol 60:279–304.
- Zandalinas SI, Mittler R, Balfagón D, et al (2018) Plant adaptations to the combination of drought and high temperatures. Physiol Plant 162:2–12.
- Zhan A, Schneider H, Lynch JP (2015) Reduced Lateral Root Branching Density Improves Drought Tolerance in Maize. Plant Physiol 168:1603–1615.
- Zhu J, Kaeppler SM, Lynch JP (2005) Mapping of QTL controlling root hair length in maize (Zea mays L.) under phosphorus deficiency. Plant Soil 270:299–310.
Keywords:
Download:
Full PDF- Share This