Stability and adaptability of soybean cultivars in Minas Gerais
Accepted: November 30, -0001
Published: August 17, 2017
Genet.Mol.Res. 16(3): gmr16039730
DOI: 10.4238/gmr16039730
Abstract
Genotypes x environment (G x E) interaction consists of different behavior of genotypes cultivated in different environments. This interaction occurs due to the performance variation of each genotype in different environments. To reduce the effect of the interaction in soybean crops, some studies have been reported in the literature to study their adaptability and stability. However, these studies are still scarce in Minas Gerais State. Thus, the aim of this study was to verify the adaptability and stability of soybean cultivars and identify the cultivars that contribute least to the G x E interaction in Minas Gerais. Six soybean cultivars were evaluated in 9 different environments. The plots were composed of 4 rows of 5 m with a spacing of 0.5 m between rows, and only the two central rows were harvested. The inoculation with Bradyrhizobium japonicum was performed through sowing furrow. The fertilization followed the recommendations of the Soil Fertility Commission of Minas Gerais. Grain yield was evaluated in kg/ha after conversion to 13% moisture. After individual analysis, the joint analysis was performed by grouping the phenotypic means by the Scott and Knott (1974) test. Wricke’s ecovalence methodologies and the Annicchiarico confidence index were applied for the adaptability and stability analysis. The interaction was decomposed into a simple and a complex part. The cultivars BRSMG 820RR and BRSMG 760SRR have wide adaptability and stability. The first one presents a better index of confidence and a small contribution to the interaction.
Introduction
In Brazil, soybean is cultivated in more than 30 million hectares, from the Rio Grande do Sul to Roraima. Under this condition, it is expected an enormous variation in environmental conditions of cultivation. Although soybean farmers are characterized by using high technology, there is variation in crop management between and within the regions of cultivation. Considering the wide environmental and lineage variation, it is expected a huge occurrence of lineage x environment interaction. Thus, the behavior of lineages is not always the same in different environments.
The nature of the interaction should be attributed to specific physiological and/ or biochemical factors of each cultivar. In genetic terms, the interaction occurs when the contribution of the alleles of different genes, which control the character and/or their level of expression, differs among the environments. This is because gene expression is influenced and/or regulated by the environment (Kang and Gauch Jr, 1996).
The interaction is the main complication of breeder’s work either when selecting the progenies or recommending new cultivars. In fact, the greatest challenge of breeders is to perform the selection and/or recommendation of a cultivar in the experimental stations in few years, aiming the future use of different management systems for farmers in the subsequent years.
There are several methods to study the stability of cultivars (Kang and Gauch Jr, 1996 Cruz et al., 2004; Ramalho et al., 2012). The ecovalence method (Wi) (Wricke, 1965) allows estimating the contribution of each genotype to the interaction. It is possible to identify cultivars that associate yield and agronomic stability. The Annicchiarico (1992) method has the confidence index (Ii) as its statistical index whose result is expressed as a percentage of the average of the environments. The confidence index allows us to estimate the risk of using each genotype.
In literature, some studies are reported to study the adaptability and stability of soybean (Vasconcelos et al., 2010; Marques et al., 2011; Barros et al., 2012; Silva et al., 2016). However, reports aiming to identify cultivars with broad adaptability and stability in Minas Gerais State are still scarce. Thus, the aim of this study was to verify the adaptability and stability of soybean cultivars and identify cultivars that contribute least to the G x E interaction in Minas Gerais.
Materials and Methods
The experiments were performed in 9 distinct environments in Minas Gerais (Table 1).
| Environments | Municipality | Crop year |
|---|---|---|
| 1 | Muzambinho | 11/12 |
| 2 | Patos de Minas | 11/12 |
| 3 | Patos de Minas | 12/13 |
| 4 | Iraí de Minas | 11/12 |
| 5 | Iraí de Minas | 12/13 |
| 6 | Uberaba | 11/12 |
| 7 | Uberaba | 12/13 |
| 8 | Sacramento | 12/13 |
| 9 | Lavras | 12/13 |
Table 1. Environments evaluated in the experiment ‘stability and adaptability of soybean cultivars in Minas Gerais’ (UFLA, Lavras, 2016).
The soil preparation followed the no-tillage system, with sowing furrows with a spacing of 0.50 m. Fertilization was carried out according to the recommendations of the Soil Fertility Commission of the State of Minas Gerais (Ribeiro et al., 1999). The inoculation was performed by sowing furrows with Bradyrhizobium japonicum, using a liquid inoculant in the proportion of 1,200,000 bacteria per seed.
Six cultivars were used: three conventional and three transgenic glyphosate-resistant (Table 2).
| Cultivar | Resistance to glyphosate | Maturity group | Growth habit |
|---|---|---|---|
| BRSMG 771 | Does not have | 7.7 | Determined |
| BRSMG 752S | Does not have | 7.5 | Undetermined |
| BRSMG 810C | Does not have | 8.1 | Determined |
| BRSMG 760SRR | Has | 7.6 | Undetermined |
| BRSMG 780RR | Has | 7.8 | Determined |
| BRSMG 820RR | Has | 8.2 | Determined |
Table 2. Cultivars evaluated in the experiment ‘stability and adaptability of soybean cultivars in Minas Gerais’ (UFLA, Lavras, 2016).
The experimental plots consisted of four rows with 5.0 m in length, with a spacing of 0.50 m between rows and seeding density of 15 plants per linear meter. The two central rows were used as useful area, eliminating 0.50 m of their borders. A randomized complete block design with three replications was used. Sowing was performed manually, and the thinning was carried out 15 days after germination. Weed management was done by the conventional method.
Grain yield was evaluated in kg/ha after conversion to 13% moisture. The individual analysis of all characters and for each environment was performed using the statistical model:
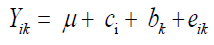
where Yik: observed value relative to the parcel that received the cultivar i in block k; μ: an inherent constant to all observation; ci: the effect of cultivar i; bk: the effect of block k; eik: the experimental error.
The joint analysis involving all the environments followed the statistical model:
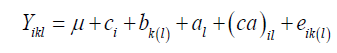
where Yikl: observed value relative to the plot that received the cultivar i in block k μ: the general average; ci: the effect of the cultivar i; bk(l): the effect of the block k in the environment l; al: the effect of the environment l; (ca)il: the effect of the cultivar x environment interaction; eik(l): the experimental error.
Data were submitted to statistical analysis with the Sisvar® software (Ferreira, 2000), using the Scott-Knott test (1974) at 5% of probability for comparison of the means. Estimates of the coefficient of variation (CV) and accuracy were used as a precision measure.
The stability of the cultivars evaluated by the method of Wricke (1965) was estimated with the means for yield. The risk of adopting a particular cultivar was also determined to adopt the confidence index (Ii) of Annicchiarico (1992). The GENES software was used for the estimates of ecovalence and confidence index. The mean square of the interaction was divided into a simple part and a composed one, using the statistical R® software, according to an estimator presented by Cruz and Castoldi (1991).
Results
Through the analysis of joint variance, it was observed that there was a significant difference for all sources of variation (Table 3). The experimental accuracy was high (Pimentel- Gomes, 2009). The estimate of CV and selective accuracy reinforce this comment. There was a significant difference between the evaluated environments, G x E interaction. The sum of squares of G x E interaction explained 59.6% of the total variation (Table 3).
| SV | d.f. | MS | Fc |
|---|---|---|---|
| Genotypes (G) | 5 | 1,822,591.84 (11.05%) | 22.51* |
| Replication / E | 18 | 193,788.63 (4.02%) | 2.39* |
| Environment (E) | 8 | 1,733,155.44 (16.08%) | 21.41* |
| G x E | 40 | 1,216,763.80 (59.04%) | 15.03* |
| G x E simple | - | 1,615.21 | |
| G x E complex | - | 18,863.60 | |
| Residue | 90 | 80,966.50 | |
| Total | 161 | ||
| Accuracy | 97.71 | ||
| CV (%) | 8.45 |
*Significant at 95% of confidence by the F-test. **Deployment of the G x E interaction in simple and complex parts, according to the methodology proposed by Cruz and Castoldi (1991). SV, sources of variation; d.f., degrees of freedom; MS, mean squares; Fc, indicate the F-value, calculated by factors mean squares/residue mean squares.
Table 3. Summary of the joint variance analysis for grain yield in kg/ha (Minas Gerais, Lavras, 2016).
The formation of two distinct groups was performed to obtain the average performance of the cultivars. The cultivars BRSMG 820RR and BRSMG 760SRR presented better agronomic performance, producing 10% more than the general average in all environments (Table 4). All cultivars showed yield above the national average of 2870 kg/ha (Table 4) (CONAB, 2016).
| Genotype | Yield (kg/ha) | Wi% | Ii% | Iif% | Iid% | |
|---|---|---|---|---|---|---|
| BRSMG 820RR | 3704.59a | 11.00 | 110.77 | 102.14 | 121.55 | |
| BRSMG 760SRR | 3696.15a | 24.48 | 10.88 | 103.41 | 120.21 | |
| BRSMG 810C | 3247.85b | 11.84 | 95.45 | 100.61 | 89.00 | |
| BRSMG 780RR | 3231.66b | 17.07 | 97.20 | 90.30 | 105.83 | |
| BRSMG 752S | 3181.40b | 19.99 | 93.28 | 104.94 | 78.70 | |
| BRSMG 771 | 3147.33b | 15.61 | 92.43 | 98.60 | 84.71 | |
Table 4. Joint means for grain yield in kg/ha in different genotypes. Minas Gerais, Lavras, 2016.
Means followed by the same letter belong to the same group by the Scott-Knott test at 95% confidence level. Wi, ecovalence method (Wricke, 1965); Ii, confidence index (Annicchiarico, 1992); Iif and Iid, favorable and unfavorable environments, respectively.
When several cultivars are available in different environments, one alternative is to identify the cultivars with greater adaptability and stability. In this case, the Wricke analysis was performed (Table 4). The cultivars BRSMG 810C and BRSMG 820RR were the ones that contributed the least to the interaction. On the other hand, despite presenting good average performance, the cultivar BRSMG 760SRR contributed to 24.48% of the interaction. Despite its low contribution to the interaction, cultivar BRSMG 810C was associated with low average yield (Table 4).
Regarding yield per environment (Table 5), the best performance was obtained in environment 8, with average above 3800 kg/ha. On the other hand, the environment 2 presented the worst yield. In this case, the yield was 83.85% of the overall average. This result is below those obtained in environments 8, 9, 4, 3, and 7 (Table 5).
| Environments | Description | Yield (kg/ha) | Index | Class |
|---|---|---|---|---|
| 8 | Sacramento 12/13 | 3854.27a | 486.33 | Favorable |
| 1 | Muzambinho 11/12 | 3612.22b | 244.17 | Favorable |
| 9 | Lavras 12/13 | 3506.35b | 138.17 | Favorable |
| 4 | Uberaba 12/13 | 3478. 32b | 110.17 | Favorable |
| 7 | Iraí de Minas 11/12 | 3465.48b | 97.33 | Favorable |
| 3 | Patos de Minas 12/13 | 3316.59b | -51.67 | Unfavorable |
| 6 | Uberaba 11/12 | 3227.88c | -140.33 | Unfavorable |
| 5 | Iraí de Minas 12/13 | 3027.89d | -340.17 | Unfavorable |
| 2 | Patos de Minas 11/12 | 2824.46e | -543.67 | Unfavorable |
Means followed by the same letter belong to the same group by the Scott-Knott test at 95% confidence level.
Table 5. Joint means for grain yield in kg/ha in different genotypes (Minas Gerais, Lavras, 2016).
To identify cultivars with a lower risk of adoption, Annicchiarico (1992), the division of the favorable (lif) and unfavorable environments (lid) were performed. The cultivars BRSMG 760RR and BRSMG 820RR were the ones with the lowest risk with a confidence index higher than 110%. It means that, at worst, both will present an average performance of 10% higher than the environment mean (Table 4). However, it is necessary to emphasize that the cultivar BRSMG 820RR contributed little to the interaction (Table 4).
The cultivars BRSMG 760RR and BRSMG 820RR maintained high confidence levels even when they were analyzed separately in favorable (Iif) and unfavorable (Iid) environments (Table 4). Environments 1, 2, 3, 4, and 5 were favorable to cultivation (Table 5) and also presented the highest grain yield means (Table 5).
Discussion
As mentioned before, the experimental accuracy was high. This fact can be justified by the number of environments available. The higher the number of repetitions, the better the estimates and the precision with the inferences and recommendations (Ramalho et al., 2012).
There was a significant difference between cultivars. Although these are from the same breeding program, there are differences in genetic background, cycle, and other attributes, ensuring the existence of variability for the present study. This variation is also reported by other studies (Fleck et al., 2007; Rezende and Carvalho, 2007; Pires et al., 2012). This fact was fundamental so that the G x E interaction could be significant.
The difference between the environments can be explained by the predictable and unpredictable environmental factors (Allard and Bradshaw, 1964) since the cultivars were tested in different locations and crop years. The environments explained approximately 16.8% of the total variation (Table 3), evidencing the need for performing experiments at several agricultural locations/crop years.
The G x E interaction was responsible for more than 59.04% (Table 3) of the total variation (Table 3). This component reports that the cultivars did not present coincidences regarding the productive performance in the different environments. The interaction division showed that there is a predominance of the complex type, representing 92.11% of the interaction. The remaining 7.89% represents the simple interaction. The complex interaction is not desired by the breeders because when it exists, there is a change in the cultivar ranking. In this context, the identification of cultivars with greater adaptability/stability is a suitable tool (Ramalho et al., 2012).
In this study, two distinct but complementary analyses were performed: Wricke and Annicchiarico. According to Wricke’s method, it is possible to identify cultivars with greater agronomic stability. That is, they contribute little to the interaction and associate responsiveness to the improvement of environmental factors (Franceschi et al., 2010). The cultivar BRSMG 820RR is responsive and contributes little to the interaction. It should be emphasized that cultivars that contribute little to the interaction but present low yield, are not interesting for the breeder. Low mean associated with stability is known as biological stability (Polizel et al., 2013).
The Annicchiarico analysis allows the identification of cultivars with greater confidence index and lower risk of adoption (Schmildt et al., 2011). The cultivar BRSMG 820RR demonstrates high yield and low risk, corroborating to the comments mentioned above. Thus, it can be inferred that besides presenting good stability, this cultivar has a superior performance than the environment average. According to the Annicchiarico test, the cultivar BRSMG 760 RR also presented a low risk, even for unfavorable environments. Both genotypes showed a performance 20% higher than the general average, even in the worst scenario (unfavorable environments). The decomposition of the confidence index in favorable and unfavorable environments is an interesting tool since it gives greater confidence to the breeders in the recommendation and the producers when adopting the cultivar.
Conclusion
The cultivars BRSMG 820RR and BRSMG 760SRR have wide adaptability and stability. The cultivar BRSMG 820RR presents a better confidence index and a small contribution to the interaction.
Acknowledgments
The authors wish to thank the researcher Cícero Monti Teixeira for the support and contribution in this paper; Conselho Nacional de Desenvolvimento Científico e Tecnológico (CNPq) and Comissão de Aperfeiçoamento de Pessoal do Nível Superior (CAPES) for granting scholarships; Fundação de Amparo à Pesquisa do Estado de Minas Gerais (FAPEMIG) for financial support; Empresa de Pesquisa Agropecuária de Minas Gerais (EPAMIG) for assistance in experimental design; and Empresa Brasileira de Pesquisa Agropecuária (Embrapa) Universidade Federal de Lavras (UFLA).
About the Authors
Corresponding Author
K.B. Silva
Departamento de Agricultura, Universidade Federal de Lavras, Lavras, MG, Brasil
- Email:
- karina.rbarroso@gmail.com
References
- Allard RW and Bradshaw AD (1964). Implications of genotype-environmental interactions in applied plant breeding. Crop Sci. 4: 503-508. https://doi.org/10.2135/cropsci1964.0011183X000400050021x
- Annicchiarico P (1992). Cultivar adaptation and recommendation from alfalfa trials in Northern Italy. J. Genet. Breed. 46: 269-278.
- Barros HB, Sediyama T, Fidelis RR and Capone A (2012). Adaptabilidade e estabilidade de genótipos de soja por meio de métodos uni e multivariado. J. Biotechnol. Biodivers. 3: 49-58.
- CONAB (2016). Acompanhamento da safra brasileira de grãos. Safra grãos 2015/2016. Available at [http://www.conab. gov.br]. Accessed September 17, 2016.
- Cruz CD and Castoldi FL (1991). Decomposição da interação genótipos x ambientes em partes simples e complexa. Rer. Ceres 38: 422-430.
- Cruz CD, Regazzi AJ and Carneiro PCS (2004). Modelos biométricos aplicados ao melhoramento genético. 3ª. ed. Editora UFV, Viçosa.
- Ferreira DF (2000). Sistema de análises de variância para dados balanceados. SISVAR 4: 1.
- Fleck NG, Lamego FP, Schaedler CE and Ferreira FB (2007). Resposta de cultivares de soja à competição com cultivar simuladora da infestação de plantas concorrentes. Cienc. Agraria 8: 213-218. https://doi.org/10.5380/rsa.v8i3.9520
- Franceschi L, Benin G, Marchioro VS, Martin TN, et al. (2010). Métodos para análise de adaptabilidade e estabilidade em cultivares de trigo no estado do Paraná. Bragantia 69: 797-805. https://doi.org/10.1590/S0006-87052010000400004
- Kang MS and Gauch Jr HG (1996). Genotype by environment interaction. CRC Press, New York.
- Marques MC, Hamawaki OT, Sedyama T, Bueno MR, et al. (2011). Adaptabilidade e estabilidade de genótipos de soja em diferentes épocas de semeadura. Biosci. J. 27: 59-69.
- Pimentel-Gomes F (2009). Curso de estatística experimental. 15ª ed. FEALQ, Piracicaba.
- Pires LPM, Peluzio JM, Cancellier LL, Santos GRR, et al. (2012). Performance of Soybean Genotypes in Central-South Region on Tocantins State, Crop Season 2009/2010. Biosci. J. 23: 214-223.
- Polizel AC, Juliatti FC, Hamawaki OT, Hamawaki RL, et al. (2013). Adaptabilidade e estabilidade fenotípica de genótipos de soja no estado do Mato Grosso. Biosci. J. 29: 910-920.
- Ramalho MAP, Abreu A de FB, dos Santos JB and Rodrigues Nunes JA (2012). Aplicações da Genética Quantitativa no Melhoramento de Plantas Autógamas. UFLA, Lavras.
- Rezende PM and Carvalho EA (2007). Avaliação de cultivares de soja [Glycine max (L.) Merrill] para o Sul de Minas Gerais. Cienc. Agrotec. 31: 1616-1623. https://doi.org/10.1590/S1413-70542007000600003
- Ribeiro AC, Guimarães PTG and Alvarez VVH (1999). Comissão de Fertilidade do Solo do Estado de Minas Gerais - CFSEMG. In: Recomendação para o uso de corretivos e fertilizantes em Minas Gerais: 5ª Aproximação. Embrapa/ UFV/SBCS, Viçosa, 25-32.
- Schmildt ER, Nascimento AL, Cruz CD and Oliveira JAR (2011). Avaliação de metodologias de adaptabilidade e estabilidade de cultivares milho. Acta Sci. Agron. 33: 51-58. https://doi.org/10.4025/actasciagron.v33i1.5817
- Scott A and Knott M (1974). Cluster-analysis method for grouping means in analysis of variance. Biometrics 30: 507-512. https://doi.org/10.2307/2529204
- Silva KB, Bruzi AT, Zuffo AM, Zambiazzi EV, et al. (2016). Adaptability and phenotypic stability of soybean cultivars for grain yield and oil content. Genet. Mol. Res. 15: 1-11. https://doi.org/10.4238/gmr.15026756
- Vasconcelos ES, Reis MS, Cruz CD, Sediyama T, et al. (2010). Adaptability and stability of semilate and late maturing soybean genotypes in Minas Gerais state. Acta Scientiarum 32: 411-415.
- Wricke G (1965). Zur berechning der okovalenz bei sommerweizen und hafer. Z. Pflanzenzuecht. 52: 127-138.
Keywords:
Download:
Full PDF- Share This