QTLs of morpho-agronomic traits in the Jalo x Small White common bean population
Published: July 28, 2017
Genet.Mol.Res. 16(3): gmr16039686
DOI: 10.4238/gmr16039686
Abstract
In this study, we aimed to estimate the relationship between some common bean traits using molecular markers and applying QTL mapping. We used a segregating population derived from a crossing between common bean cultivars, Jalo and Small White, in the Southern State of Minas Gerais. Of F2 plants, 190 F2:3 progenies were generated. Phenotypic measures related to the pod and leaf lengths and the 100-grain weight were used. DNA sampling and genotyping with SSR markers were performed in F2 plants and the pure parental. The 190 F2:3 progenies and six controls were evaluated through a 14 x 14-m triple lattice. Adjusted means of evaluations related to F2:3 were used in QTL mapping using Bayesian moving away method. Significant genetic differences were detected between parents and between progenies for all traits. The heritability estimates were 58.89, 79.39, and 50.37% for leaf length, 100-grain weight, and pod length, respectively. Genetic and phenotypic correlations were significant and ranged from 0.44 to 0.74, which indicated an association between leaf length, 100-grain weight, and pod length traits. Significant genetic correlations between the three morpho-agronomic traits may be due to associations between QTL for different traits. The most promising candidate marker was the BMD17 for leaf length; BM143 for 100-grain weight; X57211 and PVBR118 for pod length. The most promising markers, which might be used for indirect selection for all three traits, are simultaneously X57211 and BM197.
Introduction
The common bean domestication occurred separately in Mesoamerica (small seeds) and Andes (large seeds), and the seed size is the main characteristic that distinguishes these two germplasm groups (McClean et al., 1993; Hannah et al., 2000; Vieira et al., 2005). The Andean group is characterized primarily by large grains and T, C, H, and A phaseolin, while Mesoamericans have small seeds and S phaseolin (Gepts and Debouck, 1991). The seed size ranges from small (less than 20 g/100 seeds, such as Small White cultivar) to large (greater than 40 g/100 seeds, such as Jalo cultivar).
Being of different domestication centers, some cultivars (as Jalo and Small White) contrast in many traits beyond the seed size, such as the leaves and pod sizes.
According to Collicchio et al. (1997), the pod inflorescences come from changes in differentiable leaves. Thus, cultivars with small leaves will produce small pods and grains, and vice versa. However, few studies have been conducted to confirm this association. Among them, the Duarte and Adams (1972)’s study reported a positive correlation between grain size and leaf size. Regarding the pod length and 100-grain weight, Aryeetey and Laing (1973) estimated in cowpea significant genotypic correlation and high magnitude (0.95). It is not known whether these correlations arise from linkage or pleiotropy effects. An additional study involving molecular markers and trait QTL mapping could clarify the association between these traits and also be used for marker assisted selection in common breeding programs.
The objective of this study was to estimate the correlation between the traits 100-grain weight, pod length, and leaf length and identify QTL controlling these traits in a population derived from a cross between the cultivars Jalo and Small White.
Materials and Methods
Genetic material and phenotyping
The lines Jalo EEP 558 and Small White were used as the parents. The Jalo cultivar has large leaves and pods and 100-grain weight around 40 g. The Small White cultivar has small pods and leaves and 100-grain weight around 15 g. From the individual F2 plant an F2:3 progeny was obtained totaling 190 progenies. This progeny plus both parents (Jalo and Small White lines) and the lines Cornell 605, G-122, Corujinha, and CNFC 9506 used as controls were jointly evaluated. Phenotypic data were obtained during the winter season crop in Lavras, Minas Gerais, and the experimental design used was a 14 x 14-m triple lattice. The experimental plot consisted of a 1-m row with 0.60-m spacing between rows and a sowing density of 15 seeds per meter. Cultural practices were normally used in bean crops.
After the flowering of the plants, measures of the central leaflet length of a fully developed leaf of the middle third of the plant were taken. To measure the length of the pod, the longitudinal extent between the base and the apex of the pod (mm) per plant was taken. It was measured a mature pod per plant, collected in the middle third of the plant. Measurements were made of ten plants per plot. The pods were collected at the end of the crop cycle, after full maturity. The 100-grain weight (in g) was obtained by weighing on a precision scale a random sample of 100 grains per plot.
Progeny genotyping
DNA extraction was done according to the method used by Lara et al. (2015). Nucleic acids were rehydrated in Tris/EDTA buffer and quantified on 1% agarose gel using DNA markers of known concentrations. After quantitation, DNA was diluted to a concentration of approximately 10 ng/μL for the use in subsequent reactions. First, polymorphisms were investigated in the parents, performing polymerase chain reaction (PCR), with 600 pairs of random microsatellite primers (SSR) of Phaseolus vulgaris, whose sequences are available in the Bean Improvement Cooperative (BIC, 2007). After checking the polymorphism in the parents, 70 primers considered polymorphic were used to genotype the F2 population of 190 plants. Genotypes of the SSR markers were identified with scores of -1, 0, and 1 for homozygous with fewer base pairs, heterozygous, and homozygous with a greater number of base pairs, respectively.
QTL identification
Statistical analysis
We used the PROC MIXED - Statistical Analysis System Institute (SAS, 2000) for analysis of variance, considering a single score per plot, obtained from the average of the scores attributed to 10 plants.
The phenotypic and genotypic correlations between pairs of traits and their standard errors were obtained by an analogous procedure to that presented by Holland (2006) and Piepho and Möhring (2011) through of the SAS: PROC MIXED (2000).
Moving away from the marker under Bayesian analysis
In this study, low marker density was obtained, which did not allow the construction of linkage groups consistent with common bean consensus map. To mitigate this situation and to remove marker bias in the search for QTL, we chose to map multiple QTL using pivotal markers. This technique was presented by Pamplona et al. (2015) and it allows the QTL to assume variable positions within a range (distance) set by the frequency of recombination between the QTL and the marker instead of fixed intervals between two flanking markers, such as in the mapping of multiple QTL, adopting a more restricted search. In this study, we used the recombination frequency range of 0 to 0.25, adopting a pivotal marker performing a QTL searching within this range.
Thus, it is assumed that the marker is linked to the QTL with a maximum value of 0.25, and it then moves across this interval, moving away or approaching the markers used as a pivot. Therefore, it is likely that the QTL may be located at any position within this range.
For the identification of QTL, the observed variables are the phenotypic data corrected from averages of progenies y = {yi}, i = 1,... n and the genotypes of markers, while unobserved variables are the general mean b0, the genotypes of QTL (xij and wij), their effects (aj and dj), the residual, additive, and dominant variances ( σ20 , σ2a j , and σ2d j ), and the positions of the QTL, λ = {λj}, j = 1, ..., p.
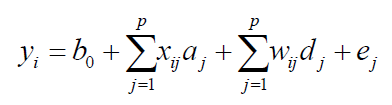
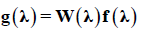
The adopted model is as follows:
 (Equation 1)
where b0 is the average of the studied population, p is the total assumed QTLs (in this case, the number of markers, assuming that each marker is linked to one QTL), aj and dj are the additive and dominance effects, respectively. The residue ei is assumed to have a normal distribution N( 0,σ20 ). The variables xij and wij are obtained from the metrics F2, as follows (Yang, 2004; Zeng et al., 2005):
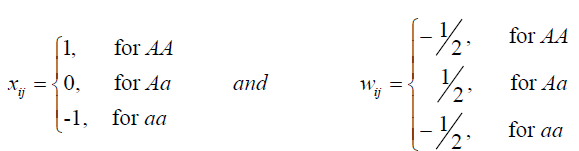 (Equation 2)
The specification of the likelihood function, the prior and posterior distributions, and Markov Chain Monte Carlo (MCMC) algorithm for a sampling of the complete conditional distributions used in this study were described by Pamplona et al. (2015).
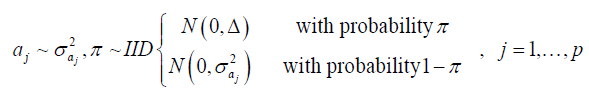
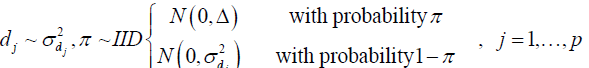
As many intervals do not contain any QTL, they are penalized and shrunk to zero by shrinkage Bayesian methodology. For this, we used a similar formulation to Bayes B, presented by Meuwissen et al. (2001), Gianola et al. (2009), and Gianola (2013). Thus, the hierarchical model can be described as:
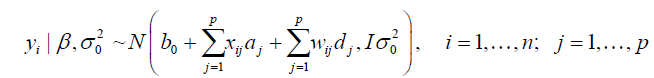 (Equation 3)
 (Equation 4)
 (Equation 5)
The prior is a mixture of a mass of points at 0 (zero) with a Gaussian distribution, where Δ = 10-8, and π and 1 - π are the mixture probabilities, respectively, where π is assumed to be known and arbitrarily specified (herein assumed π = 0.95).
For a sampling of λ positions, the distribution does not present a closed function,
and therefore, we used Metropolis-Hastings sampling. Using the priors presented herein, we
obtained a model similar to that shown by Pamplona et al. (2015), adapted to Bayes B as
described by Meuwissen et al. (2001). The conditional posteriors obtained in this model are
similar to those obtained by Pamplona et al. (2015), except that instead of the marker shrinkage factor  for the additive effect and
  for the dominance effect, the shrinkage factors were
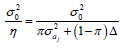 and
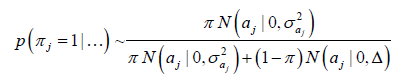
and 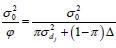 , respectively, where π:{1,0} and p(π) ~ Bernoulli(π).
 (Equation 6)
Post-MCMC analysis
The profile of the QTL intensity was represented by Yang and Xu (2007) as a function of position f (λ). However, this is not sufficiently informative for inference about the QTL in shrinkage Bayesian analysis. Based on this, Yang and Xu (2007) proposed to describe the effects of QTL according to their quadratic and weighted forms by the intensity of the position:
 (Equation 7)
where W λ = b'Vb-1b + d'V-1d , b and d are the vectors of additive and dominant effects, respectively, of QTL, Vb-1 and V-1d are the inverses of the variances of the effects of QTL given by 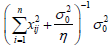 , corresponding to the inverse of the information matrix of additive
effect and
, corresponding to the inverse of the information matrix of additive
effect and 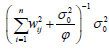 , which corresponds to the inverse of the information matrix of
dominant effect.
, which corresponds to the inverse of the information matrix of
dominant effect.
This test is equivalent to a Wald test [W(λ)] and follows an approximate chi-square distribution with two degrees of freedom (Yang and Xu, 2007). In this study, the markers considered significant for this population were those with a value of (8) greater than χ2(0.95;2) = 5.99 .
After identifying the likely QTL, the distances between markers and QTL were calculated in centimorgans, by using the Kosambi function, which assumes interference in recombination events (Kosambi, 1943). Therefore, the formula used was
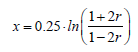 (Equation 8)
where r is the recombination frequency.
As the search for QTL may vary in the range of r = 0.25, the most probable position of a marker at a certain recombination distance is the mode in the range of 0 to 0.25. Thus, if the distribution of λ is uniform within that range, it is likely to represent no QTL. Alternatively, the intervals can be separated into groups of 1 cM to assess the relative frequency of “hits” in each group. The value of the Wald test can be weighted by the relative frequency (RF) to avoid regions little visited and with high Wald may overlap on regions much visited and with low Wald; this is possible since the change in position in the Metropolis-Hastings algorithm is based on the probability p(y|λ).
The relative frequency results multiplied by Wald (RF x Wald), heritability, and recombination frequencies are presented in graphs. For each morpho-agronomic trait, the first graph shows the RF x Wald values of 70 markers used in this study.
In the second graph for each morpho-agronomic trait, the markers are considered significant (RF x Wald > 5.99) where heritability values were higher than 50%, and other markers had their heritability values represented by zero, to more clearly visualize the results. The third graph for morpho-agronomic trait shows the recombination frequency values of the selected markers in the second graph, and the recombination frequency values of other markers are represented by zero for clear visualization of the final markers selected.
Results
Correlation between traits
In our study, all estimated correlations between the traits were significant. According to Steel et al. (1997), as the standard error is at least 50% lower than the estimate itself, it can be inferred that this correlation is significant (P < 0.05) (Table 1). The correlations were positive, indicating that some genetic and non-genetic effects were common to induce a variation of traits in the same direction.
| Traits | Correlation coefficients | |
|---|---|---|
| rg | rf | |
| Leaf length x pod length | 0.54 (0.11)* | 0.44 (0.07) |
| Leaf length x 100-grain weight | 0.58 (0.08) | 0.42 (0.07) |
| Pod length x 100-grain weight | 0.74 (0.08) | 0.51 (0.06) |
*The values in parentheses refer to errors associated with correlation estimates.
Table 1: Estimates of phenotypic (rf) and genetic (rg) correlation coefficients between leaf length, 100-grain weight, and pod length traits in common bean (F2:3 progenies of crossing Jalo x Small White) in Lavras-MG.
Regarding the magnitudes, the values ranged from 0.42 to 0.74, and all genotypic correlations were higher than the phenotypic ones, demonstrating the greater contribution of genetic factors in the association of these traits.
QTL identification
Leaf length
Among the 70 markers tested, 55 were identified as significant or associated with QTL (RF x Wald > 5.99) for the expression of leaf length trait. These markers are shown in Figure 1. Markers are represented on the abscissas and the RF x Wald values on the ordinates. The red line is the limit of 5.99 for identification of QTL, and markers with peaks represented above this line are considered significant.

Figure 1: Identification of QTL for leaf length trait in common bean with SSR markers through the RF x Wald test, using Bayesian moving away method.
Among the 55 significant markers, 13 had heritability higher than 50% (Figure 2). The red line in Figure 2 represents the limit of 50% heritability and QTL considered significant must have peaks above this line to be selected.

Figure 2: Significant QTL for leaf length trait in common bean through SSR markers, with heritability greater than 50% using Bayesian moving away method.
Importantly, markers with heritability lower than 50% are represented by zero; this was performed for better resolution of the markers selected in this step.
Heritability measures the reliability of marker-assisted selection (MAS) since it determines the percentage of genetic variation that is inherited. For this type of analysis, no pattern in the literature has defined heritability ranges that can be considered low, medium, or high. Therefore, herein, it was agreed that a minimum of 50% heritability would be considered acceptable for the use of certain markers in assisted selection. Therefore, the higher the value of heritability, the more useful and reliable the marker is
To accept that a QTL and marker are linked, it was assumed that they must be at a maximum distance of 10 cM (the considerable limit for low occurrence permutations). In Figure 3, the red line represents the 10 cM recombination frequency, and the markers linked to QTL, which are considered significant, must have a recombination frequency below this line.

Figure 3: Recombination frequencies between the 13 markers and significant QTL for leaf length in common bean through SSR markers, using Bayesian moving away method. The red points are the selected markers.
Thus, among the 13 significant markers with heritabilities greater than 50%, 11 are linked to QTL: X57211, PV-at004, ATA9, PVBR67, X60000, PVgccacc001, BM160, ATA244, BMD17, GATS91, and BM197 (Figure 3).
Of note, markers whose recombination frequencies are represented by zero in Figure 3 did not necessarily present true low values; however, for convenience, they were not represented in these graphs. Such representations were adopted to provide a better view of the peaks of the 13 markers previously selected.
Note that the marker 66, regarding the marker BMD17, stood out in the QTL identification for leaf length (Figure 1). This marker may be promising in the indirect selection because as well as being less than 1cM from the QTL (Figure 3) it has high heritability (79.37%), a criterion that defines the confidence in its use in assisted selection.
100-grain weight
For 100-grain weight trait, among the 70 markers, 64 identified significant QTL (RF x Wald > 5.99) (Figure 4). Note that the most prominent marker in QTL identification was the marker 31, which represents the BM143. This marker identified QTL with higher value RF x Wald, associated with higher heritability estimate (98.66%) and high negative additive effect (-2.90), which lead it to act more efficiently by reducing the expression of the trait; this characterizes the marker as promising to be used in assisted selection.

Figure 4: Identification of QTL for 100-grain weight trait in common bean with SSR markers through the RF x Wald test, using the Bayesian moving away method.
Among these 64 markers, 21 had heritabilities greater than 50% (Figure 5).

Figure 5: Significant QTL for 100-grain weight trait in common bean through SSR markers, with heritability greater than 50% using Bayesian moving away method.
Moreover, among these 21 markers, 20 are linked to QTL, i.e., they presented distance of up to 10 cM from a QTL (Figure 6): X57211, PV-at004, ATA9, BM185, PVM45, PVBR189, PVESTBR_279, ATA269, BM143, BM212, BMD45, PVBR11, PVESTBR_71, BMc32, BMc5, BMc68, BMc88, GATS91, BM197, and PVBR93.

Figure 6: Recombination frequencies between the 20 markers and significant QTL for 100-grain weight trait in common bean through SSR markers, using Bayesian moving away method. The red points are the selected markers.
Pod length
For pod length trait, among the 70 markers, 58 identified significant QTL (RF x Wald > 5.99) (Figure 7).

Figure 7: Identification of QTL for pod length trait in common bean with SSR markers through the RF x Wald test, using Bayesian moving away method.
Among these 58 markers, 17 had heritabilities greater than 50% (Figure 8). Moreover, among these 17 markers, 15 presented maximum distance of 10 cM from a QTL (Figure 9): X57211, PV-at008, BMc34, BM185, BM175, BM187, BM140, PVBR118, PVBR185, BN, BMc68, BMc88, BMD17, BM197, and PVBR93.

Figure 8: Significant QTL for pod length trait in common bean through SSR markers, with heritability greater than 50% using Bayesian moving away method.

Figure 9: Recombination frequencies between the 15 markers and significant QTL for pod length trait in common bean through SSR markers, using Bayesian moving away method. The red points are the selected markers./p>
Both markers that stood out are 1 and 47 (Figure 7), corresponding to the X57211 and PVBR118. These markers also showed high heritability: 78.21 and 77.49%, respectively. For this trait, both markers appear more favorable to the use in indirect selection.
Table 2 presents the common QTL for the three traits evaluated. The markers of this table are those significant (RF x Wald > 5.99) and with heritability greater than 50%.
| Marker | Da | Additive effectb | Dominance effectc | h2 (%)d | RF x Walde |
|---|---|---|---|---|---|
| Leaf Length trait | |||||
| X57211 | 0.919 | + | - | 53.447 | 204.712 |
| BM157 | 19.991 | + | - | 74.841 | 146.774 |
| BMD45 | 17.737 | + | - | 68.299 | 206.801 |
| BM197 | 1.034 | + | - | 50.768 | 230.891 |
| 100-grain Weight trait | |||||
| X57211 | 0.868 | + | + | 78.031 | 2544.885 |
| BM157 | 19.997 | + | + | 92.648 | 5152.520 |
| BMD45 | 0.476 | - | - | 73.346 | 619.973 |
| BM197 | 1.015 | + | + | 52.286 | 303.894 |
| Pod Length trait | |||||
| X57211 | 0.859 | + | - | 78.211 | 1171.260 |
| BM157 | 19.983 | + | - | 72.347 | 261.048 |
| BMD45 | 17.733 | + | + | 70.309 | 291.459 |
| BM197 | 1.027 | + | + | 58.462 | 290.229 |
aDistance in cM between the marker and the QTL; bQTL additive effect; cQTL dominance effect; dQTL heritability; eRelative frequency (in 10,000 iterations) x Wald value. (-) reduced effect; (+) increased effect.
Table 2: Coincidences between markers near significant QTL (RF x Wald > 5.99) and with heritability greater than 50% for the three traits - leaf length, 100-grains weight, and pod length - (F2:3 progenies) in common bean.
Discussion
Genetic correlation is the party of the heritability that may be caused pleiotropic effects or linked genes (Coimbra et al., 2000). The genetic correlation between leaf length and 100-grain weight traits was 0.58; between leaf length and pod length traits it was 0.54; between pod length and 100-grain weight, it was 0.74. Awan et al. (2014) evaluated 13 common bean genotypes and obtained a phenotypic correlation of 0.44 between pod length and 100-grain weight. Aryeetey and Laing (1973) estimated, in cowpea, positive significant genotypic correlations (0.95) between pod length and 100-grain weight. The significant correlations obtained in this study indicate that these traits have a positive association, as also observed by Collicchio et al. (1997). These results may suggest the presence of one or more genes responsible for the expression of these traits. In other words, it indicates the possibility of occurrence of common QTL between the traits.
The average magnitude of the correlations indicates the possibility of line selection, gathering traits of interest in common beans, as smaller leaves and pods and intermediate grain sizes.
The high number of significant QTL for the three traits may be due to the high variation in the population because the interval between the maximum and minimum averages was quite large: leaf length: 6.95 to 11.06 cm; pod length: 8.79 to 16.42 cm; and 100-grain weight: 15.19 to 31.83 g. We must remember that in this study a population obtained from a cross Andino x Mesoamerican was used. Blair et al. (2010) comment in their study that they found few QTL for Fe and Zn concentration in common bean seed and assign to the fact of using a genic intrapool crossing. They explain that in genic interpool crossings (Andean x Mesoamerican, for example) there is heterogeneity in greater numbers of genes involved in the inheritance of these traits. So there are more QTL identified when using this type of population.
Concerning the leaf length trait, reports regarding the identification of QTL for this trait were not found in the literature, which emphasizes the importance of the results found here.
Marker BM164 has been mapped to the linkage group 2 (LG2), by Davis et al. (2006), linked to a QTL engaged in the expression of the pod length, and it is flanked by markers BM139 and BM172. In this study, the markers BM139 and BM172 also identified QTL associated with pod length; however, with low heritability, 24.57 and 35.50%, respectively.
One of the principal studies in the literature using QTL mapping for 100-grain weight was performed by Blair et al. (2006). The authors evaluated phenological characteristics, plant architecture, seed weight, production, and a component of production, in a population of backcross obtained crossing Cerinza and G24404. Several findings of these authors corroborate those found in this study about QTL for 100-grain weight and, therefore, it was considered appropriate to disclose them.
Marker BM143 has been mapped in LG2, by Blair et al. (2006), linked to the QTL sw2.1 that controls seed weight (100-grain weight). Later, Cichy et al. (2009) also identified a QTL near marker BM143 engaged in the concentration of phosphorus (P) in the seed. The results of this study show that the marker BM143 identified a significant QTL for 100-grain weight trait and high heritability (98.66%); this makes it promising for use in MAS.
Blair et al. (2006) also identified the QTL sw2.2 in LG2, controlling the 100-grain weight trait, linked to the marker BM152, where one of the flanking markers is GATS91. Another study that confirms the relationship of the marker BM152 with the 100-grain weight of 100 seeds was performed by Teixeira (2004). The author identified QTL linked to this marker explaining the large percentage of the phenotypic variation for the 100-grain weight. In this study, the identified QTL by marker BM152, although significant, showed low heritability for both pod length and 100-grain weight traits. Marker GATS91 is near a QTL with high additive effect (0.60) and heritability of 77.22%.
In LG3, Blair et al. (2006) mapped the QTL sw3.1, linked to the marker BM181, flanked by markers BM197 and BM98. Among these markers, BM197 was used in this study and also identified a QTL for the evaluated traits. For leaf length trait, this marker identified a QTL with heritability of 50.77%; for pod length, the identified QTL had a heritability of 58.46%; and for 100-grain weight trait, the QTL had a heritability of 52.29%, and therefore, should explain part of the genetic correlation between these traits.
In LG4 the following markers were found: X60000 (it was found in the literature as PV-at003), mapped by Yu et al. (2000), and PVBR35 mapped by Grisi et al. (2007). Among these, the marker X60000 was used in this study, and it was associated with a QTL for leaf length trait, with heritability of 51.74%.
Marker PV-at006 was mapped in LG5, near the gene of expression of glutamine synthetase, one of the enzymes responsible for the assimilation of nitrogen by common bean (Yu et al., 2000). This marker is located near a QTL (1.02 cM) controlling the 100-grain weight trait; however, with heritability of 25.32%.
Marker BM160 was mapped in LG7 initially by Gaitán-Solís et al. (2002) and also by Blair et al. (2006) that identified in this group the QTL sw7.1 linked to ph locus and flanked by markers BM160 and BM185. BM160 is also flanking the QTL ph7.1 controlling plant height. Marker BM185 is also associated with the QTL pw7.1 expressing plant width and the QTL sp7.1 engaged in the expression of the number of seeds per plant. In this study, marker BM160, despite identifying significant QTL for pod length and 100-grain weight traits, presents low heritability, and it is distant of QTL for both traits. However, the other marker flanking the QTL, BM185, in this study, appeared linked to a QTL for both pod length and 100-grain weight traits, with high heritability (53.17 and 96.20%, respectively).
In LG8, Blair et al. (2006) mapped the QTL sw8.2 linked to the marker BM165, where one of the flanking markers is BM189, which in this study also identified QTL for 100-grain weight; however, with intermediate heritability (48.48%).
Markers BM157 and BM212 were mapped in LG10 by Davis et al. (2006) and Blair et al. (2006), respectively. The two markers are associated with QTL controlling the expression of 100-grain weight. Marker BM212 is linked to the QTL sw10.1. In this paper, these two markers also were associated significantly with QTL with high heritability for 100-grain weight and also leaf length and pod length. However, the marker BM157 segregates about 20 cM of the QTL in the three traits.
When considering the three traits, among the 70 markers, four are common. However, two markers are noteworthy, in that they are linked to QTL: X57211 and BM197 (Table 2).
These results demonstrate the occurrence of common QTL for the different traits. It can be inferred that significant genetic correlations previously estimated, ranging from 0.54 to 0.74 between the three evaluated morpho-agronomic traits, result at least in part of the effect of these QTL.
Significant genetic correlation indicates that the evaluated traits may share one or more genes responsible for its expression. These genes or QTL can be pleiotropic or linked. However, what we see is that it was possible to identify six QTL, each working on three traits, which features probably pleiotropy. It is clear that the presence or not of pleiotropy can only be confirmed by a study of QTL isolation and sequencing them.
Beyond to understand the association between the traits, the markers that identified important QTL in this study have great potential for use in indirect selection because they were associated with high heritability and are close to their QTL, which is favorable evidence to its use in the MAS. Of course, some factors should be considered, especially the efficiency of selection methods that aimed at obtaining cultivars with varying sizes of seeds, leaves, and pods.
The adoption of the markers linked to QTL that control the three traits simultaneously for assisted selection makes the use of the molecular markers more economical by using a marker for simultaneous selection of more than one feature.
According to above, significant genetic correlations between the three morphoagronomic traits are, at least in part, results of the common effects of QTL for different traits. For assisted selection of each trait, those markers considered most promising are: BMD17 to the leaf length trait; BM143 to the 100-grain weight trait; and X57211 and PVBR118 to the pod length trait. The most promising markers that may be used for indirect selection of three traits simultaneously are X57211 and BM197.
Conflicts of interest
The authors declare no conflict of interest.
Acknowledgments
The authors thank Conselho Nacional de Desenvolvimento Científico e Tecnológico (CNPq) and Coordenação de Aperfeiçoamento de Pessoal de Nível Superior (CAPES).
About the Authors
Corresponding Author
M. Balestre
Departamento de EstatÃstica, Universidade Federal de Lavras, Lavras, MG, Brasil
- Email:
- marciobalestre@des.ufla.br
References
- Aryeetey AN and Laing E (1973). Inheritance yield components and their correlation with yield in cowpea (Vigna unguiculata (L.) Walp.). Euphytica 22: 386-392.https://doi.org/10.1007/BF00022651
- Awan FK, Khurshid MY, Afzal O, Ahmed M, et al. (2014). Agro-morphological evaluation of some exotic common bean (Phaseolus vulgaris l.) genotypes under rainfed conditions of Islamabad, Pakistan. Pak. J. Bot. 46: 259-264.
- BIC (Bean Improvement Cooperative) (2007). Genetics: bean SSR primers. Bean Improvement Cooperative, Washington.Available at [http://bic.css.msu.edu/_pdf/Bean_SSR_Primers_2007.pdf]. Accessed December 20, 2015.
- Blair MW, Giraldo MC, Buend�?a HF, Tovar E, et al. (2006). Microsatellite marker diversity in common bean (Phaseolus vulgaris L.). Theor. Appl. Genet. 113: 100-109.https://doi.org/10.1007/s00122-006-0276-4
- Blair MW, Medina JI, Astudillo C, Rengifo J, et al. (2010). QTL for seed iron and zinc concentration and content in a Mesoamerican common bean (Phaseolus vulgaris L.) population. Theor. Appl. Genet. 121: 1059-1070. https://doi. org/10.1007/s00122-010-1371-0
- Cichy KA, Caldas GV, Snapp SS and Blair MW (2009). QTL analysis of seed iron, zinc, and phosphorus levels in an Andean bean population. Crop Sci. 49: 1742-1750. https://doi.org/10.2135/cropsci2008.10.0605
- Coimbra JLM, Guidolin AF, Carvalho FIF and de Azevedo R (2000). Correla�?§�?µes can�?´nicas: II - An�?¡lise do rendimento de gr�?£os de feij�?£o e seus componentes. Cienc. Rural 30: 31-35. https://doi.org/10.1590/S0103-84782000000100005
- Collicchio E, Ramalho MAP and Abreu ADFB (1997). Associa�?§�?£o entre porte da planta e o tamanho dos gr�?£os. Pesq.Agropec. Bras. 32: 297-304.
- Davis JW, Kean D, Yorgey B, Fourie D, et al. (2006). A molecular marker linkage map of snap bean (Phaseolus vulgaris).BIC Annual Reports 49: 73-74.
- Duarte RA and Adams MW (1972). A path coefficient analysis of some yield component interrelation in Field beans (Phaseolus vulgaris L.). Crop Sci. 12: 579-582. https://doi.org/10.2135/cropsci1972.0011183X001200050009x
- Gait�?¡n-Sol�?s E, Duque MC, Edwards KJ and Tohme J (2002). Microsatellite repeats in common bean (Phaseolus vulgaris)isolation, characterization, and cross-species amplification in Phaseolus ssp. Crop Sci. 42: 2128-2136.
- Gepts P and Debouck DG (1991). Origin, domestication, and evolution of the common bean, Phaseolus vulgaris. In: Common beans: research for crop improvement (van Schoonhoven A and Voysest O, eds.). Redwood Press, Melksham, 7-53.
- Gianola D (2013). Priors in whole-genome regression: the bayesian alphabet returns. Genetics 194: 573-596. https://doi. org/10.1534/genetics.113.151753
- Gianola D, de los Campos G, Hill WG, Manfredi E, et al. (2009). Additive genetic variability and the Bayesian alphabet. Genetics 183: 347-363.https://doi.org/10.1534/genetics.109.103952
- Grisi MCM, Blair MW, Gepts P, Brondani C, et al. (2007). Genetic mapping of a new set of microsatellite markers in a reference common bean (Phaseolus vulgaris) population BAT93 x Jalo EEP558. Genet. Mol. Res. 6: 691-706.
- Hannah MA, Iqbal MJ and Sanders FE (2000). The DL gene system in common bean: a possible mechanism for control ofroot-shoot partitioning. New Phytol. 147: 487-496. https://doi.org/10.1046/j.1469-8137.2000.00711.x
- Holland JB (2006). Estimating genotypic correlations and their standard errors using multivariate restricted maximum likelihood estimation with SAS Proc MIXED. Crop Sci. 46: 642-654. https://doi.org/10.2135/cropsci2005.0191
- Kosambi DD (1943). The estimation of map distances from recombination values. Ann. Eugen. 12: 172-175. https://doi.org/10.1111/j.1469-1809.1943.tb02321.x
- Lara LAC, Santos JB, Balestre M, Lima IA, et al. (2015). Identification of QTLs of resistance to white mold in common bean from multiple markers by using Bayesian analysis. Genet. Mol. Res. 14: 1124-1135. https://doi.org/10.4238/2015. February.6.16
- McClean PE, Myres JM and Hammond JJ (1993). Coefficient of parentage and cluster analysis of North American dry bean cultivars. Crop Sci. 33: 190-197. https://doi.org/10.2135/cropsci1993.0011183X003300010034x
- Meuwissen THE, Hayes BJ and Goddard ME (2001). Prediction of total genetic value using genome-wide dense marker maps. Genetics 157: 1819-1829.
- Pamplona AKA, Balestre M, Lara LAC, Santos JB, et al. (2015). A new method of QTL identification for undersaturated maps. Genet. Mol. Res. 14: 11462-11479. https://doi.org/10.4238/2015.September.25.13
- Piepho HP and M�?¶hring J (2011). On estimation of genotypic correlations and their standard errors by multivariate REML using the MIXED procedure of the SAS System. Crop Sci. 51: 2449-2454. https://doi.org/10.2135/ cropsci2011.02.0088
- SAS (2000). Statistical Analysis System Institute. SAS/STATS user’s guide. Version 8, Cary.
- Steel RGD, Torrie JH and Dickey DA (1997). Principles and Procedures of Statistics: A Biometrical Approach. 3rd edn. McGraw-Hill, New York.
- Teixeira FF (2004). Mapeamento de QTL para caracteres do feijoeiro por meio de microssat�?©lites. Master’s thesis, UFLA, Lavras.
- Vieira C, Bor�?©m A, Ramalho MAP and Carneiro JE de S (2005). Melhoramento do feij�?£o. In: Melhoramento de esp�?©cies cultivadas (Bor�?©m A, ed.), 2. ed., Vi�?§osa, 301-391.
- Yang R and Xu S (2007). Bayesian shrinkage analysis of quantitative trait Loci for dynamic traits. Genetics 176: 1169-1185. https://doi.org/10.1534/genetics.106.064279
- Yang R-C (2004). Epistasis of quantitative trait loci under different gene action models. Genetics 167: 1493-1505. https:// doi.org/10.1534/genetics.103.020016
- Yu K, Park SJ, Poysa V and Gepts P (2000). Integration of simple sequence repeat (SSR) markers into a molecular linkage map of common bean (Phaseolus vulgaris L.). J. Hered. 91: 429-434. https://doi.org/10.1093/jhered/91.6.429
- Zeng Z-B, Wang T and Zou W (2005). Modeling quantitative trait Loci and interpretation of models. Genetics 169: 1711-1725. https://doi.org/10.1534/genetics.104.035857
Keywords:
Download:
Full PDF- Share This