Phenotypic and predicted genetic approaches for genotype ranking of wheat seed yield in Brazil
Received: May 15, 2018
Accepted: August 03, 2018
Published: August 27, 2018
Genet.Mol.Res. 17(3): http://dx.doi.org/gmr18026
DOI: http://dx.doi.org/10.4238/gmr18026
Abstract
This work was aimed at determining stability and adaptability through Additive Main Effects and Multiplicative Interaction (AMMI) and Genotype Main Effects and Genotype Environment Interaction (GGE) methodologies, as well as to estimate and predict Restricted Maximum Likelihood/Best Linear Unbiased Prediction (REML/BLUP) parameters and employ them in multivariate models using wheat genotypes grown in the major wheat regions of Brazil. The trials were conducted during the 2017growing seasnon across 12 regions of Brazil, with nine wheat genotypes, arranged in three replicates. When there were significant G x E interactions, the AMMI and GGE methods were applied. The scores were represented in biplot graphs through multivariate methodology of the principal components. REML/BLUP estimates and predictions were employed in the GGE multivariate method to obtain inferences based on genetic effects, which was denominated predicted genetic GGE approach. The predicted genetic approach was superior to a phenotypic comparison to explain the effects of genotypes x environments interaction for wheat seed yield in Brazil. Specific adaptability for seed yield was established through phenotypic and genetic predicted approaches for genotypes BRS 331 and Marfimin the environment Itapeva, SP, as well as the genotype FPS Certerotoin the environment Cascavel. PR, and BRS 327 in the environment Cruz Alta, RS. The use of multivariate biometric methodologies along with the new predicted genetic approach enables reliable positioning of wheat genotypes for seed production across the main wheat regions of Brazil.
Keywords
Triticumaestivum; REML/BLUP; GGE; AMMI; strategic establishment
Introduction
Wheat (Triticumaestivum) is widespread in several regions of Brazil, where it assumes an important strategic role in agribusiness. The increasing demand requires the development of high yielding genotypes, as well as improved strategies for crop management (Benin et al., 2012; Szareski et al., 2016). In this context, the importance of reliably recommending a particular genotype for a specific growing condition is undeniable, since the main traits of agronomic interest and seed yield are determined by genetic and environmental effects, and also by the combined action of genotype by environment (G x E) interactions (Carvalho et al., 2016; Kehl et al., 2016; Woyann et al., 2018).
Due to various factors that influence the determination of which genotype should be selected for specific growing conditions, it is necessary to employ and adapt biometric models to obtain accurate and reliable estimates that minimize distortions imposed by biases intrinsic to phenotypic measurements (Bornhofen et al., 2017). Phenotypic expression of seed yield is more than 80% due to growing environment effects. Thus, because of theex pression of these effects in the estimates, genetic values can be predicted with precision and allow the reliable positioning of wheat genotypes across the varied Brazilian regions (Szareski et al., 2017).
Multivariate biometric methodologies are considered optimal alternatives to represent the additive and multiplicative effects involved in the G x E interaction. Also, they allow one to decompose the total variation of the trait of interest into fractions that are explainable and presentable through graphical dimensions. The Additive Main Effects and Multiplicative Interaction (AMMI) methodology compiles the variations imposed by G x E interaction, into principal components (EPCA), which evidences the premises of a genotype that is highly productive, stable and responsive to favorable environments (Ndhlela et al. 2014). The model Genotype Main Effects and Genotype Environment Interaction (GGE) allows grouping of correlated environments and defining of growing macro environments, as well as demonstrating genotypes that potentiate seed yield. Among its premises, the model does not allow association of genotypes with any environment when the mean is lower than the mean for each environment tested (Yan et al., 2016).
Even with the availability of advanced biometric methodologies that allow accurate estimates, these estimates can be influenced by biases intrinsic to the statistical model. One approach that may minimize these effects is the use of variance components and genetic parameters, as well as predictions (Restricted Maximum Likelihood/Best Linear Unbiased Prediction (REML/BLUP)) that allow one to investigate the genetic fraction determinant for phenotypic expression. Furthermore, these parameters enable prediction of genetic values of each genotype (Pimentel et al., 2014). These estimates and predictions can be employed in multivariate models to recommend the most suitable genotype and growing environment.
In this context, this work was aimed at determining stability and adaptability through AMMI and GGE methodologies, as well as to estimate and predict REML/BLUP parameters and employ them in multivariate models using wheat genotypes grown in the major wheat regions of Brazil.
Material and Methods
Experimental design
The trials were conducted during the 2017growing season in 12 Brazilian regions, comprising the states of Rio Grande do Sul (RS), Paraná (PR), São Paulo (SP) and Mato Grosso do Sul (MS) (Figure 1). The experimental design was randomized blocks in a factorial scheme, with 12 growing environments x nine wheat genotypes, arranged in three replicates.

Figure 1: Growing environments identification:
E1-São Gabriel – RS (30o20’09”latitude South and54o10’21”longitude West; altitude meters).
E2-Cachoeira do Sul – RS (30o17’52” latitude South and52o57’54” longitude West;altitude 113 meters).
E3- Cruz Alta – RS (28o38'19"latitude South and53o36'23”longitude West;altitude 452 meters).
E4- São Luiz Gonzaga – RS (28°24’42”latitude South and 54°45’45” longitude west;altitude 270 meters).
E5- Santo Augusto – RS (27o54’47”latitude South and 53o49’04” longitudeWest;altitude 503 meters).
E6- Passo Fundo – RS (28o13’17”latitude South and52o19’39” longitudeWest;altitude 709 meters).
E7- Ponta Grossa – PR (25º05'42"latitude South and50º09'43"longitude West;altitude 969 meters).
E8- PatoBranco – PR (26°13′42″latitude South and52°40′14″longitude West;altitude 770 meters).
E9- Cascavel – PR (24°57′20″latitude South and53°27′19″longitude West;altitude 786 meters).
E10- Nova Fátima – PR (23°25′57″latitude South and50°33′55″longitude West;altitude 651 meters).
E11- Itapeva – SP (23º58'56" latitude South and48º52'32"longitude West;altitude 684 meters).
E12- Dourados – MS (22º13'16" latitude South and 54º48' 20" longitude West;altitude 430 meters).
Plant material
The genotypes used were G1 (BRS 327), G2 (BRS 331), G3 (FPS Certero), G4 (FPS Nitron), G5 (FPS Virtude), G6 (FPS Amplitude), G7 (Marfim), G8 (TBIO Iguaçu) andG9 (TBIOSinuelo). The growing environments tested were: E1 (São Gabriel – RS), E2 (Cachoeira do Sul - RS), E3 (Cruz Alta – RS), E4 (São Luiz Gonzaga – RS), E5 (Santo Augusto – RS), E6 (Passo Fundo – RS), E7 (Ponta Grossa – PR), E8 (Pato Branco – PR), E9 (Cascavel – PR), E10 (Nova Fátima – PR), E11 (Itapeva – SP) and E12 (Dourados – MS).
The experimental units consisted of five rows spaced 0.20 meters, five meters in length. Seeding was carried out in the first half of June 2016 (standard criterion for all growing environments). Population density was 380 viable seeds per square meter. Nutrient management was based on 250 kg ha-1 of NPK (08-25-20) at sowing, and 50 kg ha-1 of nitrogen as topdressing (Urea: 46% nitrogen) applied in the full tillering stage. The control of weeds, insect-pests and diseases were carried out in order to minimize biotic effects in the experiment. Seed yield (RS) was measured by harvesting the useful area of each experimental unit (5.0 m2), with seed mass adjusted to 13% humidity and to kg ha-1.
Statistical analysis
The data were submitted to variance analysis at 5% probability, verifying the assumptions model additivity, residue normality and variance homogeneity (Ramalho et al., 2000). Subsequently, the interaction between growing environments and wheat genotypes was calculated. When there was significant G x E interaction, the AMMI method was used, which combines the variances of genotype additive effects and growing environments with the multiplicative effects of the G x E interaction. The scores were represented in biplot graphs through multivariate analysis of the principal components (Zobel et al., 1988). The AMMI model was based on the phenotypic inferences of seed yield.

Where: Yij: represents the experimental unit’s average response of the ith genotype (i) in the jth growing environment (j); μ: corresponds to the general mean of genotypes in the growing environments; gi: appears as the main effects attributed to the i genotype; aj: represents the main effect of the j growing environment; λk, yik and αjk: correspond to the decomposition of the G x E matrix that captures the pattern associated with the interaction of the igenotype with the j growing environment, and weighs the additive deviations of the trait of interest (Yij) in relation to the main effects of gi and aj; ρij: represents the distortion that will be eliminated from the analysis concerning G x E interaction; εij: corresponds to the experimental error (Duarte and Vencovsky, 1999).
The GGE method combines the effects attributed to genotypes and G x E interaction (Yan et al., 2000). It allows identification of high yielding genotypes efficient in certain growing environments. In the same way, it allows the designation of macroenvironments (Woyann et al., 2016). The GGE model was based on the phenotypic inferences of seed yield.
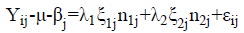
Where: Yij: represents the expected magnitude of the igenotypegrown in the j environment; μ: corresponds to the overall mean of the Yij observation; βj: evidenced as the main effect attributed to the j growing environment; λ1 and λ2: correspond to the principal (PC I) and secondary (PC II) scores determinants for the graphic expression through the biplot principal components; ξ1j and ξ2j: evidenced as eigenvectors that represent the igenotype in the axes of PC I and PC IIabcissas; εij: expresses the unadjusted residue of the statistical model.
The Restricted Maximun Likelihood (REML) method was used to estimate variance components and genetic parameters, where significance was obtained through deviance analysis at 5% probability by the Chi-square test (Resende, 2007). The statistical model Y = Xr + Zg + Wi + e was employed, where: y: is the data vector, r: are the effects of replicates (fixed), g: are the genotypic effects (random); i: are the effects of genotype x environment interaction (random), e: are the residues (random). Thus, we estimated the genotypic variance (σ²G), variance of genotype x environment interaction (σ²INT), phenotypic variance (σ²P), residual variance (Ve), broad sense heritability of genotype´s average (ĥ²mg), accuracy of genotype selection (Acgen),coefficient of determination of genotype x environment interaction effects (C²INT), genotypic correlation between performances of environments (rgloc), coefficient of genotypic variation (CVg), coefficient of residual variation (CVe) and overall mean. The REML/BLUP estimates and predictions were employed in the GGE multivariate method to obtain inferences based on genetic effects, which was denominated the predicted genetic GGE approach. For statistical analysis, the software Statistical Analysis System® (SAS, 1989), GENES (Cruz, 2013), R (R Core Team, 2015®) and Selegen (Resende, 2007) were used.
Results and Discussion
The analysis of variance revealed significant interactions between growing environments x wheat genotypes for seed yield at 5% probability. Among the variation factors, we found that growing environments influenced the total variation of the trait more than 90% (Table 1). These results allow us to estimate the stability and adaptability of wheat genotypes in the environments. Under these conditions, a coefficient of variation of 11.57% was obtained, which is low and reflects reliable estimates (Table 1). The overall mean of the experiment was 3691 kg ha-1 of grain yield, 13.9% higher than the Brazilian national average, 12.9% above the Rio Grande do Sul state average, 15.2% higher than the average for São Paulo state, 36.9% above the average for Mato Grosso do Sul state, and 14.9% above the average for Paraná state (Conab, 2017).

Table 1: Analysis of variance(ANOVA) for grainyield of wheat, scores of multivariate adaptability and stability (AMMI) for nine genotypes grown in 12 environments in the states of Rio Grande do Sul, Paraná, Mato Grosso do Sul and São Paulo, Brazil.
Additive main effects and multiplicative interaction analysis (AMMI)
The first axis of the principal components (EPCAI) was responsible for 41.06% of the general effects attributed to G x E interactions. The magnitude of effects for seed yield is justifiable because this trait is controlled by many genes responsible for phenotypic expression, low heritability, continuous distribution and a large influence of the growing environment (Yokomizo et al., 2013). Research conducted in 10 growing environments and 42 wheat genotypes revealed 86.2%G x E interaction effects through the first principal component (EPCA) to estimate the adaptability and stability of genotypes regarding grain yield (Szareskiet al., 2017).
When considering the principal components (EPCA) contribution, significance at 5% probability was found for EPCA I(41.06%), EPCA II (19.94%) and EPCA III (16.53%). These three principal components together infer 77.53% of information referring to the standard fraction extracted from the total effects of G x E interaction. In the adequate graphical representation of the scores in the principal components (EPCA I, II, III), these axes must be independent in order to minimize biases and maximize the correct interpretation of inferences about growing environments and genotypes (Silveira et al., 2016).
The biplot graph for AMMI (EPCA I) represented 41.06% of the G x E interaction, where the environments E4 (São Luiz Gonzaga - RS), E11 (Itapeva - SP) and E12 (Dourados - MS) were stable and predictable, minimally contributing to G x E interaction (Table 1, Figure 2 A). On the other hand, stable environments must present high seed yield. This condition was evidenced in the environment E4 (São Luiz Gonzaga - RS). The environments E2 (Cachoeira do Sul - RS), E3 (Cruz Alta - RS), E5 (Santo Augusto - RS), E7 (Ponta Grossa - PR), E9 (Cascavel - PR) and E10(Nova Fátima - PR) were considered unstable and non predictable, however, with high seed yield.

Figure 2: Plotting of EPCA I, EPCA II and EPCA III principal components scores regarding genotype x environment interaction obtained through the AMMI method for seed yield of nine wheat genotypes grown in 12 environments in the states of Rio Grande do Sul, Paraná, Mato Grosso do Sul and São Paulo. These being: E1-São Gabriel – RS, E2-Cachoeira do Sul – RS, E3-Cruz Alta – RS, E4-São Luiz Gonzaga – RS, E5-Santo Augusto – RS, E6-Passo Fundo – RS, E7-Ponta Grossa – PR, E8-Pato Branco – PR, E9-Cascavel – PR, E10-Nova Fátima – PR, E11-Itapeva – SP, E12-Dourados – MS. Genotypes: G1 (BRS 327), G2 (BRS 331), G3 (FPSCertero), G4 (FPSNitron), G5 (FPS Virtude), G6 (FPS Amplitude), G7 (Marfim), G8 (TBIO Iguaçu) and G9 (TBIOSinuelo).
Considering the effects attributed to genotypes, smaller influences of G x E interaction were found for G3 (FPS Certero) and G7 (Marfim), the former being considered superior for this trait. Duarte and Vencovski (1999) suggested that unstable genotypes with high seed yield should not be discarded due to their specific adaptability to certain growing environments. This condition was evidenced for G6(FPS Amplitude), G1 (BRS 327), G9 (TBIOSinuelo) and G8 (TBIO Iguaçu) (Table 1; Figure 2 A).
Specific adaptability was found for the genotypes G3 (FPS Certero), G6 (FPS Amplitude) and G9 (TBIOSinuelo) for the environments E2 (Cachoeira do Sul – RS), E4 (São Luiz Gonzaga – RS), E5 (Santo Augusto – RS), E9 (Cascavel – PR) and E10 (Nova Fátima – PR).The genotypes G1 (BRS 327) and G8 (TBIO Iguaçu) were positioned for growth in the environment E3 (Cruz Alta - RS). For genotypes G2 (BRS 331), G4 (FPS Nitron) and G7 (Marfim), the environments E6 (Passo Fundo – RS) and E11 (Itapeva – SP) were indicated. The genotype G5 (FPS Virtude) was indicated for environments E7 (Ponta Grossa – PR), E8 (Pato Branco – PR) and E12 (Dourados – MS).
The biplot graph for AMMI (EPCA II) represented 19.94% of effects attributed to G x E interaction, allowing us to infer stability and predictability for E1 (São Gabriel - RS); however, this environment presented low seed yield. Instability was found for genotypes G2 (BRS 331) and G8 (TBIO Iguaçu), which strongly contributed to G x E interaction (Table 1; Figure 2 B). The biplot graph for AMMI (EPCA III) represented 16.53% of effects of G x E interaction, where the environments E6 (Passo Fundo - RS) and E8 (Pato Branco - PR) presented instability and low seed yields. Similar behavior was observed for genotypes G4 (FPS Nitron) and G5 (FPS Virtude) (Table 1; Figure 3 C).

Figure 3: Plott of principal components scores for classification of genotypes based on their behavior through the GGE method for seed yield of nine wheat genotypes grown in 12 environments of Rio Grande do Sul, Paraná, Mato Grosso do Sul and São Paulo. Being: E1-São Gabriel – RS, E2-Cachoeira do Sul – RS, E3-Cruz Alta – RS, E4-São Luiz Gonzaga – RS, E5-Santo Augusto – RS, E6-Passo Fundo – RS, E7-Ponta Grossa – PR, E8-Pato Branco – PR, E9-Cascavel – PR, E10-Nova Fátima – PR, E11-Itapeva – SP, E12-Dourados – MS. Genotypes G1 (BRS 327), G2 (BRS 331), G3 (FPSCertero), G4(FPSNitron), G5 (FPS Virtude), G6 (FPS Amplitude), G7 (Marfim), G8 (TBIO Iguaçu) and G9 (TBIOSinuelo).
Genotype main effects and Genotype environment interaction (GGE - Phenotypic)
The performance of a given genotype in each growing environment tested may be displayed by interconnecting the scores attributed to genotypes located at extreme coordinates in the biplot graph, forming a polygon related to maximum performance (Yan and Kang, 2003; Yan and Tinker, 2006). This polygon reveals the best genotype for each environment (Alwala et al., 2010). When genotypes are located internally in the macroenvironment, they are defined as specifically adapted to those environments. Thereby, identifying that different genotypes are specifically adapted to groups of environments allows the designation of macroenvironments (Yan and Kang, 2003). The definition of a macroenvironment is attributed to the relation between edaphoclimatic features and intrinsic environments management, since its definition allows one to indicate genotypes of wide or specific adaptability to certain environments, or groups of environments (Trethowan et al., 2001).
The GGE method allows us to comprehend them acroenvironments and the lack of relation between graphic and general averages (Yan and Tinker, 2006). The phenotypic approach (GGE - Phenotypic) revealed the formation of four macroenvironments with explainability of 61% of the G x E interaction effects. Macroenvironment I was composed of the environments E4 (São Luiz Gonzaga - RS) and E11 (Itapeva–SP), being considered of high performance for seed yield. This macroenvironment joined the genotypes G2 (BRS 331) and G7 (Marfim), where the former presented high performance in these correlated environments and was located at the polygon vertex (Figure 3; GGE).
Macroenvironment II gathered the enviroments E1(São Gabriel - RS), E9(Cascavel - PR) and E6 (Passo Fundo - RS),which defined the environments E1(São Gabriel - RS) and E9(Cascavel - PR) as of high performance. In this situation, the genotypes G3 (FPS Certero) and G8 (TBIO Iguaçu) are placed, being the second characterized as of high performance. Macroenvironment III was composed only of the environment E3 (Cruz Alta - RS) and reunited the genotypes G1 (BRS 327) and G4 (FPS Nitron), being the first one of high performance. Macroenvironment IV associated the environments E5 (Santo Augusto - RS), E7 (Ponta Grossa - PR), E8 (PatoBranco - PR), E10 (Nova Fatima - PR) and E12 (Dourados - MS), recommending the genotypes G5 (FPS Virtude) and G9 (TBIO Sinuelo) as of wide adaptability to this set of environments, being both of great potential.
Six genotypes were necessary to form the polygon (Figure 3; GGE) responsible for indicating which genotypes presented high productive performance, being them G1(BRS 327), G2 (BRS 331), G5 (FPS Virtude), G6 (FPS Amplitude), G8 (TBIO Iguaçu) and G9 (TBIO Sinuelo). In general, stood out the growing environments E1 (São Gabriel – RS), E9 (Cascavel – PR) and E11 (Itapeva – SP).
Components of variance and genetic parameters
The estimates of variance components and genetic parameters obtained through Restricted Maximum Likelihood (REML) revealed that genotypic variance (σ²G) contributed 23.37% to the phenotypic manifestation (σ²P) of seed yield (Table 2). The increment of genotypic variance directly influences the effects of G x E interaction (Annicchiarico, 2002; Silva et al., 2011). Seed yield (σ²P) was influenced 38.12% due to the effects of G x E interaction (C2INT), and the differential effects of the interaction were determined to be61.30% due to total genetic effects.
Through estimates of broad sense heritability (h2mg), it was possible to verify that growing environment influenced seed yield phenotypic expression 77%. These effects are due to the genetic nature of this trait, which is controlled by many genes that modify its expression according to variations imposed by the growing environment (Borges et al., 2010; Phiepo et al., 2012). Research by Szareski et al. (2017), evaluating 42 wheat genotypes during two growing seasons in the state of Rio Grande of Sul-Brazil, showed that the growing environment effects were responsible for 88% of the variation in seed yield. According to Benin et al. (2012), 73% of the phenotypic manifestation of wheat yield in the state of Paraná-Brazil was due to environment effects.
Our experiment revealed high accuracy (Acgen: 0.91) and adequate quality of results, which allows us to make inferences with confidence and to reliably position the best genotypes (Resende, 2007). The genetic correlation between genotypes across the growing environments (rgloc) was low, which indicates that differential effects of G x E interaction are of complex nature. This outcome might hinder selection strategies and the positioning of some genotypes for seed yield (Rosado et al., 2005).
The coefficient of genotypic variation (CVg) allows us to quantify the genetic fraction determinant for the trait’ss total variation, which was high (9.2%) and demonstrates genetic variability among the wheat genotypes. However, when we examined the coefficients of genetic and residual variation, a ratio (CVg/CVe) smaller than 1.0 was observed. Under these conditions, the strategies for selecting suitable genotypes through previously established genetic parameters may be difficult. High coefficients of genotypic variation indicate greater possibility for selecting the best genotypes (Vencovsky and Barriga, 1992; Resende and Duarte, 2007).
Genotype main effects and Genotype environment interaction (GGE – predicted genetic)
This approach consists of using predicted genetic values (BLUP) to guide the inferences obtained by the multivariate GGE model, allowing to minimize biases attributed to environment effects (Table 2; Figure GGE_GP). Graphically, it was possible to identify the formation of three macro environments. Even though there are contrasting environments in this study, this approach allowed us to join them in the same macro environment, due to the principle of the predicted genetic model that minimizes biases attributed to noncontrollable characteristics. It was useful for positioning wheat genotypes with the lowest probability of mistakes in recommending them for specific environments.
Under these conditions, macro environment was characterized by only the E1environment (São Gabriel - RS), which was considered of high performance in the general context, grouping the genotypes G1 (BRS 327) and G8 (TBIO Iguaçu). Macroenvironment II was composed of the environments E2 (Cachoeira do Sul – RS), E3(Cruz Alta – RS), E4(São Luiz Gonzaga – RS), E6 (Passo Fundo – RS), E8(Pato Branco – PR), E10(Nova Fátima – PR) na E11 (Cachoeira do Sul – RS),with the environments E8 (Pato Branco - PR) and E10 (Nova Fatima - PR) giving high predicted genetic performance for wheat seed yield. Macroenvironment III joined the environments E5 (Santo Augusto – RS), E7 (Ponta Grossa – PR) and E12 (Dourados – MS), indicating the genotype G9 (TBIOSinuelo) as having high genetic potential for seed production, which can be considered of broad adaptability to specific Brazilian conditions. The genotypes G2 (BRS 331), G4 (FPS Nitron) and G5 (FPS Virtude) had high performances; however, they were not related to any specific growing environment. Furthermore, the genotype G7 (Marfim) expressed low predicted genetic performance and absence of specific relation to any of the environments.
For this approach, seven genotypes were required to compose the polygon of high seed yield performance, which were G1 (BRS 327), G2 (BRS 331), G3 (FPS Certero), G4 (FPS Nitron), G5 (FPS Virtude), G8 (TBIO Iguaçu) and G9 (TBIOSinuelo). All of these genotypes were associated with specific growing environments (Figure 3 GGE_GP). In general, the growing environments that presented high performance were E1 (São Gabriel – RS), E8 (PatoBranco – PR) and E10 (Nova Fátima – PR).
AMMI x PhenotypicGGE x Predicted genetic GGE
The use of various multivariate biometric methodologies allows us to reliably select and recommend genotypes for specific growing conditions. The AMMI method explained 77.53% of the variation imposed by G x E interaction through three principal components, which is explainable by the model’s standard fraction. However, the phenotypic GGE multivariate approach designated 61% of the variation imposed by G x E interaction in two principal components. In contrast, applying estimates of variance components (REML), genetic parameters and genetic predictions (BLUP) to the predicted genetic GGE explainability of 78.65% of the differential effects of G x E interaction (Figure 3 GGE_GP) was achieved. Therefore, the use of this strategy is justifiable to better represent variations in highly representative trials.
There was concordance between phenotypic and predicted genetic approaches for AMMI and GGE models, which revealed stability and predictability forgenotypeG7 (Marfim). Specific adaptability was evidenced for genotypes G2 (BRS 331) and G7 (Marfim) in the growing environment E11 (Itapeva – SP). The genotype G3 (FPS Certero) to the environment E9 (Cascavel - PR), while the genotype G1(BRS 327) was indicated for the environment E3 (Cruz Alta - RS). The genotype G3 (FPSCertero) presented high performance for growing environments E2 (Cachoeira do Sul - RS), E4 (São Luiz Gonzaga - RS) and E10 (Nova Fátima - PR).
This work allowed us to infer about components of variance and genetic parameters (REML), predictions (BLUP), stability and adaptability through AMMI and GGE methods. This compiled information allows development of reliable strategies for recommending suitable genotypes in the main growing regions of Brazil. The inferences obtained in this research will aid in future research on agricultural sciences and seed technology, especially to define the potential of Brazilian wheat regions for grain production.
Conclusion
The predicted genetic approach was superior to the phenotypic approach to explain the effects of genotype x environment interactions for wheat seed yield in Brazil. Specific adaptability for seed yield was established through phenotypic and genetic predicted approaches for genotypes BRS 331 and Marfim in the environment Itapeva - SP, as well as genotype FPS Certero for the environment Cascavel - PR and BRS 327 for the environment Cruz Alta - RS.
The genotypes BRS 327, FPS Certero, FPS Amplitude, TBIO Iguaçu and TBIOSinuelo gave high seed yield and specific adaptability. The use of multivariate biometric methodologies along with the new predicted genetic approach enables reliable positioning of wheat genotypes for seed production across the main wheat regions of Brazil.
Conflicts of interest
The authors declare no conflicts of interest.
About the Authors
References
- Alwala S, Kwolek T, McPherson M, Pellow J, et al. (2012). A comprehensive comparison between Eberhart and Russel joint regression and GGEbiplot analyses to identify stable and high yielding maize hybrids. FieldCropsRes. 119: 225-230. https://doi: 10.1016/j.fcr.2010.07.010
- Annicchiarico P. (2002). Genotype x environment interactions – challenges and opportunities for plant breeding and cultivar recommendations. FAO Plant Production and Protection.Rome, Italy
- Benin G, Pinnow C, Silva CL,Pagliosa ES, et al.(2012). Biplot analysis of spring wheat genotypes grown under differing management levels. Bragantia. 71:28-36.http://dx.doi.org/10.1590/S0006-87052012000100005
- Bornhofen E, Benin G, Storck L, Woyann LG, et al. (2017). Statistical methods to study adaptability and stability of wheat genotypes. Bragantia. 76: 1-10. http://dx.doi.org/10.1590/1678-4499.557
- Borges V, Soares AA, Reis MS, Resende MDV, et al.(2010). Genotypic performance of lines of the upland rice using mixed model.Bragantia.69:833-841. http://dx.doi.org/10.1590/S0006-87052010000400008
- Carvalho IR, Nardino M, Pelegrin AJ, Ferrari M, et al. (2016). Path analysis and Annicchiarico method applied in relation to protein in corn grains. Australian Journal of Basic and Applied Sciences. 10:300-306.
- Cruz CD. (2013). GENES - A software package for analysis in experimental statistics and quantitative genetics. ActaSci.Agron.35:271-276. https://doi: 10.4025/actasciagron.v35i3.21251
- Conab. (2017).Twelfth survey, September 2017, Survey of Brazilian grains harvest, v. 4 Harvest 2016/17 - Twelfth survey, Brasília, p. 1-158 September 2017.
- Kehl K, Kehl K, Szareski VJ, Carvalho IR, et al.(2016). Genotype environment interaction under industrial and physiological quality of wheat seeds. Int. J.Curr. Res. 8: 38461-38468.
- Ndhlela T, Herselman L, Magorokosho C, Setimela P, et al. (2014).Genotype × Environment interaction of maize grain yield using AMMIbiplots. Crop Sci. 54:1992-1999. http://dx.doi:10.2135/cropsci2013.07.0448
- Piepho HP, Williams ER, Maddlen LV. (2012). The use of two-way linear mixed models in multitreatment meta-analysis. Biometrics. 68:1269-1277.http://dx.doi:10.1111/j.1541-0420.2012.01786.x
- Pimentel AJB, Guimarães JFR, Souza MA, Resende MDV, et al. (2014). Estimation of genetic parameters and prediction of additive genetic value for wheat by mixed models. PesqAgropec Bras. 49:882-890. http://dx.doi:10.1590/S0100-204X2014001100007
- Pupin S, Santos AVDA, Zaruma DUG, Miranda AC, et al.(2015). Productivity, stability and adaptability in open pollination progenies of Eucalyptus urophylla S.T. Blake.Sci.For,43:127-134.
- Resende MDV. (2007). Software SELEGEN-REML/BLUP: Sistema estatístico e seleção genética computadorizada via modelos lineares mistos.Colombo: Embrapa Florestas.
- Resende MDV and Duarte JB. (2007). Precision and Quality Control in Variety Trials. Pesq.Agropec.Tropic. 37:182-194.
- Rosado AM, Rosado TB, Alves AA, Laviola BG, et al.(2012). Simultaneous selection of eucalyptus clones based on yield, stability and adaptability. Pesq.Agropec. Bras.47:964-971. http://dx.doi.org/10.1590/S0100-204X2012000700013
- Silva RR, Benin G, Silva GO, Marchioro VS, et al.(2011). Adaptability and stability of wheat cultivars at different sowing dates in the state of Paraná, Brazil.PesqAgropec.Bras. 46:1439-1447.http://dx.doi.org/10.1590/S0100-204X2011001100004
- Szareski VJ, Carvalho IR, Kehl K, Levien AM, et al. (2017). Univariate, multivariate techniques and mixed models applied to the adaptability and stability of wheat in the Rio Grande do Sul State. Genet. Mol. Res. 16: 1-13. https://doi.org/10.4238/gmr16039735
- Szareski VJ, Carvalho IR, Nardino M, Demari GH, et al.(2016). Phenotype stability of soybean genotypes for characters related to the physiological quality of seeds produced under different environmentall conditions. Aust. J. Basic Appl. Sci. 10: 279-289.
- Trethowan RM, Crossa J, Ginkel M, Rajaram S.(2001).Relationships among bread wheat international yield testing locations in dry areas.Crop Sci.41:1461-1469. https://doi:10.2135/cropsci2001.4151461x
- Yan W, Frégeau-Reid J, Pageau D, Martin R. (2016).Genotype-by-environment interaction and trait associations in two genetic populations of oat.Crop Sci.56:1136-1145. https://doi:10.2135/cropsci2015.11.0678
- Yan W and Kang MS. (2003).GGE biplot analysis: a graphical tool for breeders, geneticists, and agronomists. Flórida: Boca Raton.
- Yan W and Tinker A. (2006).Biplot analysis of multi environment trial data: principles and applications. Can.J.PlantSci.86:623-645. https://doi:org/10.4141/P05-169
- Yokomizo GKI, Duarte JB, Vello NA, Unfried JR. (2013). AMMI analysis of grain yield in soybean lines selected for resistance to Asian rust. Pesq.Agropec.Bras. 48:1372-1380. https://doi:10.1590/S0100-204X2013001000009
- Woyann LG, Melioli AS, Bozi AH, Dallo SC, et al.(2018). Repeatability of associations between analytical methods of adaptability, stability, and productivity in soybean. Pesq. Agropec. Bras. 53:63-73. https://doi:10.1590/S0100-204X2018000100007
- Vencovsky R and Barriga P. (1992).Genética biométrica no fito melhoramento. Sociedade Brasileira de Genética. Ribeirão Preto.
Keywords:
Download:
Full PDF- Share This