Phenotypic and genotypic correlations between soybean agronomic traits and path analysis
Published: June 20, 2017
Genet.Mol.Res. 16(2): gmr16029696
DOI: 10.4238/gmr16029696
Abstract
The goals of this research were to evaluate the phenotypic and genotypic correlations between agronomic traits, to perform path analysis, having as main character grain yield, and to identify indirect selection criteria for grain yield. The experiment was carried out in an experimental area located at Capim Branco farm, which belongs to Federal University of Uberlândia, during the growing season of 2015/2016.Twenty-four soybean genotypes were evaluated under randomized complete block design with three repetitions, of which agronomic traits and grain yield were measured. There was genetic variability for all traits at 5% probability level through the F-test. Thirty significant phenotypic correlations were also observed with values oscillating from 0.42 to 0.87, which indicated a high level of association between some evaluated traits. Additionally, we verified that phenotypic and genotypic correlations were essential of the same direction, being the genotypic ones of superior magnitudes. Plants with superior vegetative cycle had longer life cycles; this fact could be explained by the significant phenotypic correlations between the number of days to the blooming and number of days to maturity (0.76). Significantly positive phenotypic and genotypic correlations for the total number of pods per plant and grain yield per plant (0.84) were observed. Through the path analysis, the trait that contributed the most over grain yield was the number of pods with three seeds as it showed the highest direct effect on grain yield per plant, as well as a strong indirect effect on the total number of pods. Therefore, the phenotypic and genotypic correlations suggested high correlations between grain yield and number of branched nodes, the number of pods with two and three seeds, and the total number of pods. Also, the path analysis determined the number of pods with three seeds as having the highest favorable effect on grain yield, and thus, being useful for indirect selection toward productive soybean genotypes.
Introduction
The achievement of soybean genotypes that can succeed existing cultivars on the market is the final goal of genetic breeding programs. By that, the cultivars should have resistance to main pest and diseases of the crop, as well as being efficient on water and nutrient uptake and, at the same time, having valuable nutritional traits and high standards for grain yield (Ramalho et al., 2012). However, this last trait is complex, and it has resulted from the expression and association of different components, which are highly influenced by the environment.
Studies on correlations between characters are indeed important to breeding programs as it enables to perform indirect selection for a quantitative trait, usually hard to be selected, by another directly correlated trait of higher genetic gain or easy visual selection; besides, it is also able to access how a trait can interfere on another (Bárbaro et al., 2007; Cruz et al., 2012).
It is known that the selection for a certain trait can eventually bring effects on others with or without interest to breeding. Accordingly, the knowledge of correlations between traits is useful especially for soybean grain yield since it allows the breeder to use that additional information to discard or promote genotypes of interest (Carpentieri-Pípolo et al., 2005).
Whether the correlation between two characters is of phenotypic, genotypic, or environmental nature, it is the genotypic one that determines higher interest for genetic breeding as it involves an association of heritable nature (Nogueira et al., 2012). Therefore, the study of correlation is crucial to identifying traits that can be used as grain yield indirect selection.
Leite et al. (2015), when analyzing genotypic and phenotypic correlations in 28 soybean genotypes, asserted moderate to high correlations between the plant height at maturity with the height of insertion of the first pod and grain yield, indicating that the selection for plant height at maturity directly influences the other characters.
Rodrigues et al. (2015), while studying genotypic and phenotypic correlations in soybean genotypes infected by naturally occurring Phakopsora pachyrhizi, have concluded that the total number of pods is a useful trait for indirect selection of soybean genotypes with high yield standards.
The quantification and interpretation of the magnitude of correlation can result in equivocation for selection strategy because high correlations may be derived from the effect of a third or a group of traits (Cruz et al., 2012). Thus, path analysis, developed by Wright (1923), allows unfolding coefficients of correlations into direct and indirect effects over a primary variable (Alcantara Neto et al., 2011).
In this context, path analysis is an important tool that the breeder can have to understand possible causes on the associations between traits and, at the same time, divide the existent correlation into direct and indirect effects on the main and explanatory variables (Cabral et al., 2011). For Schuster (1996), the path analysis resides basically on formulating the relationship of cause-effect between variables.
When analyzing the correlations and path analysis in 90 soybean genotypes over two sowing seasons, Nogueira et al. (2012) concluded that the total number of pods per plant and number of nodes of the main stem could be used as an indirect selection basis for soybean grain yield. Silva et al. (2014) indicated that the effect of a total number of pods on soybean grain yield is based on indirect effect from the number of seed per plant.
To this end, this research aimed at evaluating the genotypic and phenotypic correlations between important agronomic traits for soybean genetic breeding, as well as performing path analysis, that has as main character grain yield and identifying indirect selection criteria for grain yield.
Materials and Methods
The experiment was carried out during the growing season of 2015/2016 in an experimental area located at Capim Branco farm (18°52'S; 48°20'W and 805 m in altitude), belonging to Federal University of Uberlândia, in the city of Uberlândia, Minas Gerais, Brazil.
The meteorological data of the experimental field during the occurrence of the experiment can be found in Figure 1.

Figure 1: Temperature and precipitation averages at Capim Branco farm in Uberlândia-MG, growing season 2015/2016, during the months of December 2105 to April 2016. Source: Meteorological Station of Capim Branco farm and National Institute of Meteorology (INMET).
Twenty-one soybean lines developed by the Soybean Breeding Program of the Federal University of Uberlândia, and three cultivars (UFUS 7910, UFUS Guarani, and Msoy-6101) were evaluated under randomized complete block design with three repetitions.
The experimental plot has consisted of four soybean plant rows with 5m in length, spaced at 0.5m within rows. The useful area was composed of 2 middle rows, wherein 0.5m was discarded on each edge of the middle rows, resulting in a useful area of 4m2.
The experimental field is situated on a dystrophic Dark Red Latosol. The soil preparation for seeding was done through conventional tillage system with one plowing and two harrowing. The chemical characteristics of the soil sampling from 0 to 20 cm in depth, in Uberlândia were: 0.0 Al3+ (cmolc/dm3); 3.4 Ca2+ (cmolc/dm3); 1.3 Mg2+ (cmolc/dm3); 0.4 K+ (cmolc/dm3); 1.5 of H+ and Al3+ (cmolc/dm3); 16.6 P Meh-1 (mg/dm3); 2.5 MO (dag/kg), and pH 6.2 (H2O).
Before sowing, the seeds were treated with fungicide Carbendazim and Tiram (Protreat®), and after, they were inoculated with two strains of the bacteria Bradyrhizobium japonicum.
The sowing occurred manually on December 5, 2015, adopting 16 seeds per linear meter as an average. The control of weeds was done through herbicide application of S-Metolachlor (Dual Gold®) right after sowing the seeds and Haloxyfop-P-Methyl (Verdict®) 20 days after sowing. Meanwhile, complementary weeding was done as often as necessary.
At 30 days after emergence, a 100 mL/ha dose of cobalt and molybdenum (Nectar®) was applied. To control P. pachyrhizi fungi, field applications with Trifloxystrobin and Prothioconazole (Fox®) were done at doses of 0.4 L/ha. Furthermore, to control pests, field applications with both 0.4 kg/ha Acephate (Achero®), and 200 mL/ha Thiamethoxam and Lambda - Cyhalothrin (Platinum Neo®) were done whenever necessary.
In the useful area, five plants were randomly sampled, which were identified with colored ribbon. Using visual observation, measurements were performed by the stages of soybean development proposed by Fehr and Caviness (1977).We evaluated plant height at flowering (PHF) and plant height at maturity (PHM); number of nodes in the main stem at the blooming (NNB) and number of nodes on the main stem at maturity (NNM); number of branched nodes (NBN); number of days to the blooming (NDB) and number of days to maturity (NDM); number of pods with one grain (NP1), with two grains (NP2) and three grains (NP3); total number of pods per plant (TNP); average 100-grain weight (HGW) and grain yield (Y, kg/ha).
Being tabulated all data, phenotypic and genotypic correlation analyses were done adopting the effect of genotype as fixed, according to the resulting estimators.
Phenotypic correlation
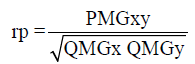 (Equation 1)
where rp: estimator of phenotypic correlation; PMGxy: mean product associated with the effects of genotypes for x and y traits; QMGx: mean square among the genotypes for the character X; QMGy: mean square among the genotypes for the character Y.
Genotypic correlation
Correlations and path analysis in soybean agronomic traits
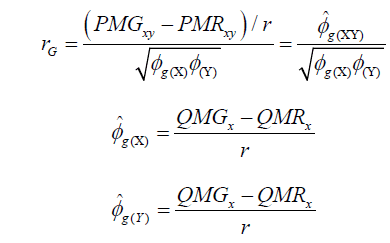 (Equation 2)
where  estimator of genotypic covariance;
  estimators of the quadratic components associated with genotypic variability for characters X and Y, respectively.
The phenotypic correlation significance was estimated by the t-test with n-2 degrees of freedom, by which the “n” corresponds to the number of genotypes evaluated. The significance of genotypic correlations was evaluated through the bootstrap method with 5000 simulations. Statistical analysis was accomplished by using the Genes program (computational application in genetics and statistics) (Cruz, 2016).
For path analysis, the multicollinearity diagnosis involving seven traits was performed. The degree of multicollinearity was established according to Montgomery and Peck (1981). It is based on values of the determinant and condition number that consist of the ratio between the largest and smallest eigenvalue of the matrix. To identify the traits that contributed toward the appearance of multicollinearity, eigenvector elements associated with eigenvalues were analyzed.
Results and Discussion
We verified the existence of genetic variability for all analyzed traits (Table 1), indicating the possibility of selection among soybean genotypes. When analyzing the correlation between traits on F6-derived recombinant inbred lines developed by the Soybean Breeding Program of UFU and coming from seven biparental crosses, Sousa et al. (2015) also found the existence of genetic variability for the traits in the study.
| Traits | MS | H2 (%) | CV (%) |
|---|---|---|---|
| Plant height at flowering | 255.67* | 82.25 | 9.71 |
| Plant height at maturity | 268.42* | 85.26 | 7.15 |
| Number of nodes at bloom | 6.06* | 73.02 | 11.57 |
| Number of days to bloom | 96.15* | 96.42 | 3.27 |
| Number of days to maturity | 114.78* | 94.35 | 2.13 |
| Grain yield per plant | 36.32* | 51.88 | 38.79 |
| Number of nodes at maturity | 4.60* | 87.32 | 4.49 |
| Number of branched nodes | 10.26* | 92.69 | 13.49 |
| Number of pods with two seeds | 191.06* | 64.75 | 44.84 |
| Number of pods with three seeds | 89.81* | 47.55 | 56.50 |
| Total number of pods | 1277.49* | 67.27 | 28.86 |
*Significant at 5% probability level by the F-test. MS: mean squares; H2: genotypic determination coefficient; CV (%): coefficient of variation.
Table 1: Mean square, determination coefficient, and coefficient of variation of agronomic traits in inbred lines and soybean cultivars cultivated in the city of Uberlândia over the growing season of 2015/2016.
Approaches for the genotypic determination coefficient (H2) oscillated from 47.55% (NP3) to 96.42% (NDB). Excepted for TNP, NP2, NP3 and Y, all traits showed high values for this parameter, that is, higher than 70%, which indicates that the differences observed among the genotypes are mainly of genetic nature. Similar results were achieved by Glasenapp et al. (2015), which found H2 values superior to 70% for some traits in the study.
The coefficient of variation (CV) fluctuated from 2.13% (NDM) to 56.50% (NP3). High values for CV production components are acceptable under conditions that are evaluated as quantitative, and therefore, highly influenced by the environment (Leite et al., 2015).
The estimates of coefficients for phenotypic and genotypic correlations between pairs of traits can be found in Table 2. According to Cruz et al. (2012), beyond significance, it should also be considered the magnitude and direction to interpret correlations correctly. In regards to direction, the correlations can be positive, which indicates a trend of increasing a variable when another increase; otherwise, when negative, it suggests a possibility of increasing a variable value while reducing another (Nogueira et al., 2012).
| Traits | PHM | NNB | NDB | NDM | Y | NNM | NBN | NP2 | NP3 | TNP | |
|---|---|---|---|---|---|---|---|---|---|---|---|
| PHF | rp | 0.72** | 0.59** | 0.65** | 0.48* | -0.05 | 0.52** | 0.39 | -0.04 | -0.28 | -0.07 |
| rg | 0.75++ | 0.77++ | 0.73++ | 0.55+ | 0.04 | 0.63++ | 0.50+ | 0.01 | -0.34 | 0.00 | |
| PHM | rp | 0.37 | 0.21 | 0.17 | -0.36 | 0.49* | 0.02 | -0.42* | -0.39 | -0.51* | |
| rg | 0.49 | 0.23 | 0.19 | -0.52 | 0.54+ | 0.05 | -0.56+ | -0.59 | -0.64+ | ||
| NNB | rp | 0.60** | 0.36 | 0.43* | 0.47 | 0.66** | 0.41 | 0.06 | 0.42* | ||
| rg | 0.67++ | 0.44 | 0.56 | 0.52+ | 0.77++ | 0.48 | 0.47 | 0.47 | |||
| NDB | rp | 0.76** | 0.14 | 0.49* | 0.66** | 0.31 | -0.09 | 0.31 | |||
| rg | 0.08++ | 0.20 | 0.54+ | 0.69++ | 0.38 | -0.13 | 0.40 | ||||
| NDM | rp | -0.04 | 0.39 | 0.31 | 0.15 | -0.09 | 0.004 | ||||
| rg | -0.08 | 0.4 + | 0.32 | 0.20 | -0.13 | 0.01 | |||||
| Y | rp | -0.04 | 0.61** | 0.58** | 0.70** | 0.84** | |||||
| rg | -0.25 | 0.73++ | 0.40 | 0.64 | 0.84++ | ||||||
| NNM | rp | 0.20 | 0.24 | -0.27 | -0.01 | ||||||
| rg | 0.19 | 0.23 | -0.59 | -0.13 | |||||||
| NBN | rp | 0.44* | 0.21 | 0.70** | |||||||
| rg | 0.47+ | 0.19 | 0.78++ | ||||||||
| NP2 | rp | 0.10 | 0.71** | ||||||||
| rg | -0.21 | 0.69+ | |||||||||
| NP3 | rp | 0.56 ** | |||||||||
| rg | 0.42 |
** and *Significant at 1 and 5% probability level by the t-test; ++ and +Significant at 1 and 5% by the bootstrap method with 5 thousand simulations. PHF and PHM: plant height at flowering and at maturity, respectively; NNB and NNM: number of nodes on the main stalk at bloom and at maturity, respectively; NDB and NDM: number of days to bloom and to maturity, respectively; Y: grain yield per plant; NBN: number of branched nodes; NP2 and NP3: number of pods with two seeds and with three seeds, respectively; TNP: total number of pods per plant.
Table 2: Coefficient of phenotypic (rp) and genotypic (rg) correlations between 11 traits from 24 soybean genotypes cultivated in Uberlândia over the growing season of 2015/2016.
Although it is possible to increase statistical significance levels for phenotypic and genotypic correlations, researchers tend to value mostly the signal and magnitude of applied interpretation on correlations. Thus, it is common to be valued estimates above 0.5 in the module (Lopes et al., 2002).
The occurrence of genotypic correlation between two traits can eventually happen due to pleiotropism or gene binding imbalance. Pleiotropism is one of the causes of high correlations since one gene can influence the expression of more than one trait. Accordingly, this fact improves the simultaneous selection of two or more traits by the selection of only one of them (Falconer and Mackay, 1996).
A useful trait for indirect selection for breeding is characterized by the occurrence of phenotypic and genotypic correlations of high magnitude with another desirable trait. However, the selection of a trait can lead to the undesirable selection of another trait (Almeida et al., 2010; Ramalho et al., 2012).
The phenotypic correlation between traits can be achieved directly through measurements or evaluation between two traits. Despite having genetic and environmental causes, the genetic correlations are heritable and can be used in breeding programs (Cruz et al., 2012).
The occurrence of 23 significant phenotypic correlations was identified by the t-test, whose estimates fluctuated from 0.42 to 0.84, indicating a high level of association between some evaluated traits. Phenotypic correlations higher than 0.70 have been considered significant, even though it is possible to perform indirect selection when values are higher than 0.50 (Lopes et al., 2002). Correlation coefficients equal to zero were verified between some traits in analysis; nevertheless, it does not demonstrate a lack of relationship but the lack of linear relation between them (Cruz et al., 2012).
For most traits, genotypic correlations were higher than the phenotypic ones, and they had the same direction. According to Almeida et al. (2010), this demonstrates that genetic factors contributed more than the environmental factor to the correlations. Similar results were accomplished by Sousa et al. (2015) when evaluating the correlations between soybean agronomic traits; they reported higher genotypic correlation values rather than phenotypic ones to nearly all traits except for plant height at flowering and plant height at maturity. Nogueira et al. (2012) and Leite et al. (2015), in studies regarding genotypic correlations between agronomic traits in soybean genotypes, also observed genotypic correlations superior to phenotypic correlations and with the same direction.
Plants with longer vegetative cycle also tend to have longer life cycles that can be explained by the significant phenotypic and genotypic correlations between NDB and NDM (0.76). These results corroborate with the ones found by Nogueira et al. (2012), Salimi and Moradi (2012), and Sousa et al. (2015).
The positive correlation between PHF and NDM indicates that the higher the number of days to flower is the higher plants are most likely to be at the same development stage. Sousa et al. (2015) found a phenotypic correlation of 0.59 for those traits. Hence, the correlation between PHM and NNM demonstrates that by selecting taller plants at maturity, it would result in plants with a higher number of nodes. The PHM trait has also shown a significant positive correlation with PHF (0.75). Furthermore, similar results were found by Rodrigues et al. (2015), in studies regarding soybean genotypes naturally infected by P. pachyrhizi fungi.
The TNP is one of the soybean yield components that have the highest direct effect on total grain yield (Alcantara Neto et al., 2011; Vianna et al., 2013; Dallastra et al., 2014; Rodrigues et al., 2015).
It was observed significant positive phenotypic and genotypic correlations for TNP and Y (0.84). Thus, the direct selection for a higher number of pods per plant can enhance the selection toward achieving higher yield performance per plant. These results are in agreement with the ones accomplished by Nogueira et al. (2012), that when evaluating the phenotypic and genotypic correlation between agronomic traits in 90 soybean genotypes, achieved a phenotypic correlation of 0.76 for the same analyzed traits. Likewise, carrying out the same type of analysis, Sousa et al. (2015) found positive correlations of 0.59 for those traits.
Beyond the correlation with Y, the TNP has also shown a positive correlation with NP3; such results are in agreement with Rodrigues et al. (2015). Considering that the trait that demonstrated the highest correlation with grain yield was the TNP, other traits that were also correlated with TNP, such as Y, NBN, NP2, and NP3, should also be important to breeding programs.
Moreover, it was observed coefficients of significant positive phenotypic and genotypic correlations for plant height at maturity with both plant height at flowering and number of nodes at maturity. Similar results were achieved by Leite et al. (2015) studying correlations between 28 soybean genotypes.
Almeida et al. (2010), analyzing correlations among soybean cultivars grown under irrigated floodplain, have stated that the grain yield character showed a significant positive phenotypic correlation between the number of days to flower, indicating that the selection of plants with late flowering would result in higher grain yield per plant.
There is, however, a divergence in regards to the results found in this current research, which can be probably caused because of different genetic materials and in the environment where those experiments were carried out.
Although the coefficients of correlation are useful for quantifying the magnitude and direction of correlations between traits, they can result in misconceptions to selection strategies as a high magnitude of a correlation between two traits can occur due to the indirect effect of a third or a group of traits (Cruz et al., 2012). Consequently, path analysis is a method that helps breeding programs on performing indirect selection by confirming the obtained results from correlation analysis between traits and avoiding misconceptions throughout the selection.
In this context, a path analysis allows the breeder to better comprehend the association between different traits by unfolding correlation coefficients into direct and indirect effects using main and explanatory variables. In this study, it was adopted the grain yield as the main variable.
In Table 3, the estimates of direct and indirect effects between grain yield variable and explanatory variables were shown, which are NNB, NBN, NP2, NP3, and TNP.
| Traits | P | G |
|---|---|---|
| Direct effect of NNB on Y | 0.070 | -0.379 |
| Indirect effect via NBN | 0.136 | 0.921 |
| Indirect effect via NP2 | 0.119 | 0.501 |
| Indirect effect via NP3 | 0.034 | 0.053 |
| Indirect effect via TNP | 0.070 | -0.528 |
| Total | 0.432 | 0.5683 |
| Direct effect of NBN on Y | 0.204 | 1.183 |
| Indirect effect via NNB | 0.047 | -0.295 |
| Indirect effect via NP2 | 0.127 | 0.492 |
| Indirect effect via NP3 | 0.115 | 0.216 |
| Indirect effect via TNP | 0.115 | -0.86 |
| Total | 0.6107 | 0.7324 |
| Direct effect of NP2 on Y | 0.288 | 1.039 |
| Indirect effect via NNB | 0.029 | -0.183 |
| Indirect effect via NBN | 0.090 | 0.559 |
| Indirect effect via NP3 | 0.055 | -0.237 |
| Indirect effect via TNP | 0.117 | -0.768 |
| Total | 0.5808 | 0.4099 |
| Direct effect of NP3 on Y | 0.534 | 1.123 |
| Indirect effect via NNB | 0.004 | -0.018 |
| Indirect effect via NBN | 0.044 | 0.228 |
| Indirect effect via NP2 | 0.029 | -0.220 |
| Indirect effect via TNP | 0.931 | 0.467 |
| Total | 0.7061 | 0.6454 |
| Direct effect of TNP on Y | 0.163 | -1.101 |
| Indirect effect via NNB | 0.030 | -0.182 |
| Indirect effect via NBN | 0.144 | 0.928 |
| Indirect effect via NP2 | 0.206 | 0.725 |
| Indirect effect via NP3 | 0.304 | 0.477 |
| Total | 0.8494 | 0.8472 |
| Determination coefficient | 0.83 | 0.86 |
| Residual effect | 0.40 | 0.36 |
TNP: total number of pods per plant; NNB: number of nodes on the main stalk at bloom; NBN: number of branched nodes; NP2 and NP3: number of pods with two seeds and with three seeds, respectively; Y: grain yield per plant.
Table 3: Estimates of direct, indirect phenotypic (P) and genotypic (G) effects of NNB, NBN, NP2, NP3, and TNP traits on grain yield in 24 soybean genotypes cultivated in Uberlândia over the growing season of 2015/2016.
The high value for determination coefficient of path analysis (0.83) and low effect of the residual variable (0.40) showed that there were strong cause and effect relationships between the analyzed variables. Besides, their relationships with grain yield were considered as a positive parameter on path analysis and corroborated with results of determination coefficient found by Alcantara Neto et al. (2011), Nogueira et al. (2012), Silva et al. (2014), and Teodoro et al. (2015).
It was verified that the trait of highest influence on grain yield was the number of pods with three seeds (NP3) as it showed a direct effect on grain yield per plant and, at the same time, caused a high indirect effect on the total number of pods. This trait had an indirect effect via the number of pods with three seeds on grain yield since its coefficient (0.931) was superior to the residual effect (0.40). Therefore, the number of pods can be considered as a valuable option to soybean breeding in the case of an indirect selection for high grain yield.
In path analysis between number of pods per plant, number of grains per pod and 100-grain weight over grain yield from ninety soybean genotypes cultivated during two growing seasons, Nogueira et al. (2012), accomplished similar results when analyzing a more suitable scenario for indirect selection to more productive genotypes in regards to the total number of pods per plant. For instance, Li et al. (2013), studying the correlations and path analysis between green soybean traits in northeast China, verified that the number of pods with three seeds and number of pods with two seeds were the performance components that contributed the most to the pod production.
Alcantara Neto et al. (2011), when carrying out path analysis between main and explanatory soybean yield components, verified that the number of pods per plant was the trait that influenced the most on soybean yield. Still, Silva et al. (2014), in a path analysis among soybean yield components, stated that the number of seeds per plant was the main component having direct effect on soybean yield and that the effect of number of pods per plant on yield was based on indirect effect of number of seeds per plant.
Conclusion
The phenotypic and genotypic correlations have indicated high correlations between grain yield and the number of branched nodes, the number of pods with two and three seeds, and the total number of pods.
The path analysis has confirmed that the number of pods with three seeds is the trait that causes a higher favorable effect on grain yield and the trait total number of pods per plant can be used for indirect selection toward increasing soybean productivity.
About the Authors
Corresponding Author
B.Q.V. Machado
Instituto de Ciências Agrárias, Universidade Federal de Uberlândia, Uberlândia, MG, Brasil
- Email:
- beliza_queiroz@hotmail.com
References
- Alcantara Neto F, Gravina GA, Monteiro MMS, Morais FB, et al. (2011). Análise de trilha do rendimento de grãos de soja na microrregião do Alto Médio Gurguéia. Comun. Sci. 2: 107-112.
- Almeida RD, Peluzio JM and Afferri FS (2010). Correlações fenotípicas, genotípicas e ambientais em soja cultivada sob condições várzea irrigada, sul do Tocantins. Biosci. J. 26: 95-99.
- Bárbaro IM, da Centurion MAP, Mauro Di OOD, Unêda-Trevisoli SH, et al. (2007). Variabilidade e correlações entre produtividade de grãos e caracteres agronômicos de soja com aptidão para cultivo em áreas para reforma de canavial. Científica (Jaboticabal) 35: 136-145.
- Cabral PDS, Soares TCB, Lima ABP, Bastos YJ, et al. (2011). Análise de trilha do rendimento de grãos de feijoeiro (Phaseolus vulgaris L.) e seus componentes. Rev. Cien. Agron. 42: 132-138. https://doi.org/10.1590/S1806-66902011000100017
- Carpentieri-Pípolo V, Gastaldi LF and Pipolo AE (2005). Correlações fenotípicas entre caracteres quantitativos em soja. Semin. Cienc. Agrar. 26: 11-16.https://doi.org/10.5433/1679-0359.2005v26n1p11
- Cruz CD (2016). Genes Software - extended and integrated with the R, Matlab and Selegen. Acta Agron. 38: 547-552. https://doi.org/10.4025/actasciagron.v38i3.32629
- Cruz CD, Regazzi AJ and Carneiro PCS (2012). Modelos biométricos aplicados ao melhoramento genético (volume 1).4th edn. UFV, Viçosa.
- Falconer DS and Mackay TFC (1996). Introduction to quantitative genetics. 4th edn. Longmans Green, Harlow.
- Fehr WR and Caviness CE (1977). Stages of soybean development. Iowa State University of Science and Technology, Ames.
- Glasenapp JS, Sediyama T, Cruz CD, Matsuo E, et al. (2015). Diversidade de características agronômicas e moleculares em cultivares de soja com diferentes graus de resistência à Phakopsora pachyrhizi. Biosci. J. 31: 25-36. https://doi. org/10.14393/BJ-v31n1a2015-17166
- Leite WS, Pavan BE, Matos Filho CHA, Feitosa FS, et al. (2015). Estimativas de parâmetros genéticos e correlações entre caracteres agronômicos em genótipos de soja. Nativa (Sinop) 3: 241-245. https://doi.org/10.14583/2318-7670. v03n04a03
- Li YS, Du M, Zhang QY, Hashemi M, et al. (2013). Correlation and path coefficient analysis for yield components of vegetable soybean in northeast China. Legume Res. 36: 284-288.
- Lopes ACA, Vello NA, Pandini F, Rocha MM, et al. (2002). Variabilidade e correlações entre caracteres em cruzamentos de soja. Sci. Agr. 59: 341-348. https://doi.org/10.1590/S0103-90162002000200021
- Montgomery DC and Peck EA (1981). Introduction to linear regression analysis. Jonh Wiley & Sons, New York.
- Nogueira APO, Sediyama T, Sousa LB, Hamawaki OT, et al. (2012). Análise de trilha e correlações entre caracteres em soja cultivada em duas épocas de semeadura. Biosci. J. 28: 877-888.
- Ramalho MAP, Santos JB, Abreu AFB and Nunes JAR (2012). Aplicações da genética quantitativa no melhoramento de plantas autógamas. UFLA, Lavras.
- Rodrigues B, Serafim F, Nogueira APO, Hamawaki OT, et al. (2015). Correlations between traits in soybean (Glycine max L.) naturally infected with Asian rust (Phakopsora pachyrhizi). Genet. Mol. Res. 14: 17718-17729.https://doi.org/10.4238/2015.December.21.45
- Salimi S and Moradi S (2012). Effect the correlation, regression and path analysis in soybean genotypes (Glycine max L.) under moisture and normal condition. Int. J. Agron. Plant Prod. 3: 447-454.
- Schuster I (1996). Correlações, coeficientes de trilha, composição de gluteninas e qualidade do trigo para panificação.UFV, Viçosa.
- Silva AF, Sediyama T, Silva FCS, Bezerra ARG, et al. (2014). Correlation and path analsysis of soyben componentes. Int.J. Plant Anim. Environ. Sci. 5: 177-179.
- Sousa LB, Hamawaki OT, Santos Júnior CD, Oliveira VM, et al. (2015). Correlation between yield components in F6 soybean progenies derived from seven biparental crosses. Biosci. J. 31: 1692-1699. https://doi.org/10.14393/BJ-v31n6a2015-26217
- Teodoro PE, Ribeiro LP, Corrêa CCG, Luz Júnior RAA, et al. (2015). Path analysis in soybean genotypes as function of growth habit. Biosci. J. 31: 794-799. https://doi.org/10.14393/BJ-v31n1a2015-26094
- Vianna VF, Unêda-Trevisoli SH, Desidério JA, Santiago S, et al. (2013). The multivariate approach and influence of characters in selecting superior soybean genotypes. Afr. J. Agric. Res. 8: 4162-4169.
- Wright S (1923). Theory of path coefficients. Genetics 8: 239-255.
Keywords:
Download:
Full PDF- Share This