Genotypic gain with simultaneous selection of production, nutrition, and culinary traits in cowpea crosses and backcrosses using mixed models
Accepted: November 30, -0001
Published: August 17, 2017
Genet.Mol.Res. 16(3): gmr16039736
DOI: 10.4238/gmr16039736
Abstract
The aim of this study was to estimate the genotypic gain with simultaneous selection of production, nutrition, and culinary traits in cowpea crosses and backcrosses and to compare different selection indexes. Eleven cowpea populations were evaluated in a randomized complete block design with four replications. Fourteen traits were evaluated, and the following parameters were estimated: genotypic variation coefficient, genotypic determination coefficient, experimental quality indicator and selection reliability, estimated genotypic values ​​- BLUE, genotypic correlation coefficient among traits, and genotypic gain with simultaneous selection of all traits. The genotypic gain was estimated based on tree selection indexes: classical, multiplicative, and the sum of ranks. The genotypic variation coefficient was higher than the environmental variation coefficient for the number of days to start flowering, plant type, the weight of one hundred grains, grain index, and protein concentration. The majority of the traits presented genotypic determination coefficient from medium to high magnitude. The identification of increases in the production components is associated with decreases in protein concentration, and the increase in precocity leads to decreases in protein concentration and cooking time. The index based on the sum of ranks was the best alternative for simultaneous selection of traits in the cowpea segregating populations resulting from the crosses and backcrosses evaluated, with emphasis on the F4BC12, F4C21, and F4C12 populations, which had the highest genotypic gains.
Introduction
Cowpea [Vigna unguiculata (L.) Walp.] is a species that presents a great agronomic potential, nutritional, versatility, and adaptation to diverse environmental conditions (Freire Filho, 2011). It is a good alternative to compose food in the tropical and subtropical regions of the world since it is low oil content, has high protein content, vitamins, and minerals (Vasconcelos et al., 2010; Carvalho et al., 2012).
Among the seven billion people in the current world population, about two billion suffer from micronutrient malnutrition and almost 800 million of caloric deficiency; and of 129 countries consulted, 57 have high levels of malnutrition and overweight adults, including obesity (IFPRI, 2016).
Biofortification, a process of improving the nutrients present in food crops, represents a sustainable way of making more micronutrients available. This approach will not only reduce the number of severely malnourished people who require treatments for complementary interventions but will also help them maintain a healthy nutritional profile. Besides, biofortification is a viable means of reaching the rural population with malnutrition, generally with limited access to markets for fortified foods and marketed supplements (Singh et al., 2016). It is accessible and traditional, as it acts to increase the nutritional quality of basic food sources, such as beans and rice. These foods are considered one of the most important sources of nutrients for poorer population (Ribeiro et al., 2011). The adoption of biofortified cultivars by farmers depends on other traits present, such as high yield, resistance to pests and diseases, and commercial and culinary quality.
The cowpea breeding program from Embrapa Meio-Norte has developed and made available in the Brazilian market cultivars with high grain yield, good commercial grain quality, resistance to viruses, and high protein, iron, and zinc concentrations in the grain (Freire Filho, 2011; Rocha et al., 2017). However, not all of these traits are brought together in a single cultivar. According to Cruz et al. (2012), the use of selection indexes assists the breeder in the identification of superior genotypes for several traits simultaneously, attending the expectations of producers, marketing, and consumers.
The selection indexes have been little used in practice in cowpea breeding programs. However, studies conducted in Brazil (Santos and Araújo, 2001; Dias, 2009; Bertini et al., 2010; Silva, 2015; Torres, 2015; Rodrigues et al., 2016) have shown advantages of their use concerning the directed selection of superior genotypes. Several selection indexes have been proposed, among them those that have been most used in cowpea in Brazil: the classical, proposed by Smith (1936) and Hazel (1943), the multiplicative, proposed by Subandi et al. (1973), the sum of ranks, proposed by Mulamba and Mock (1978), and the selection index, proposed by Williams (1962). This selection strategy is very advantageous in a breeding program since it is less expensive, faster, and with the possibility of simultaneous gains for several traits. Therefore, in the face of scarce human and financial resources, the identification of genotypes that present superiority simultaneously to several traits should be a strategy to be used by cowpea breeding programs.
Studies using different selection indexes to simultaneously select superior cowpea genotypes based on agronomic, nutritional, and culinary traits have not been found in the literature. Furthermore, due to the difficulties of gathering in a single genotype several desirable traits, the aim of this study was to estimate the genotypic gain with the simultaneous selection of production, nutrition, and culinary traits in cowpea crosses and backcrosses and to compare different selection indexes.
Materials and Methods
Eleven populations of cowpea were evaluated: three parental (BRS Xiquexique, IT- 98K-205-8, and IT-97K-1042-3) and eight segregating F4 populations derived from crosses between them and backcrosses for BRS Xiquexique. BRS Xiquexique cultivar comes from the cowpea breeding program at Embrapa Meio-Norte, in Teresina, Piauí, and IT-98K-205-8 and IT-97K-1042-3 lines are derived from the International Institute of Tropical Agriculture (IITA) Cowpea Breeding Program in Ibadan, Nigeria.
The eight segregating populations were represented by plants in the F3 (plant)/F4 (seed) generations, obtained from the BRS Xiquexique x IT-98K-205-8 and BRS Xiquexique x IT-97K-1042-3 crosses (C) and backcrosses (BC) to the BRS Xiquexique parent, including reciprocal ones (Moura et al., 2012).
An experiment was conducted at the Embrapa Meio-Norte experimental field in Teresina, Piauí, Brazil, in a randomized complete block design with 11 treatments (parents and progenies) and four replications. The plot was constituted by four rows spaced 0.80 m, with spacing between plants within the row of 0.30 m. The useful area was composed of two central rows of 80 plants, where the data were collected.
The following traits were evaluated: number of days to start flowering - number of days elapsed from planting to appearance of first flowers; number of days for maturity - number of days elapsed from planting to physiological maturation of pods, plant type - scale of visual notes (1 - erect: main branch and short branches with the insertion of the secondary branches forming an acute angle with the main branch, 2 - semi-erect: main branch and short branches with the insertion of the secondary branches perpendicular to the main branch, 3 - semi-prostrate: main and secondary branches of medium size with the lower secondary branches touching the ground and tending to support themselves in vertical supports, and 4 - prostrate: long main and secondary branches with the lower secondary branches touching the soil and tendency to lean on vertical supports), cultivation value: scale of visual notes (1- with no characteristic adequate to commercial cultivation, 2 - with few suitable characteristics for commercial cultivation, 3 - with a good part of the characteristics suitable for commercial cultivation, 4 - with most of the characteristics suitable for commercial cultivation, and 5 - with all the characteristics suitable for commercial cultivation), plant lodging - scale of visual notes (1- with no fallen plant, 2 - with 1 to 5% of fallen plants, 3 - with 6 to 10% of fallen plants; 4 - with 11 to 20% of fallen plants, and 5 - with more than 20% of fallen plants), pod length - obtained as a mean of a sample of 10 pods randomly collected in the useful area of the plot, number of grains per pod - obtained as an average of a sample of grains of 10 pods randomly collected in the useful area of the plot, weight of one hundred grains - obtained as an average of 100 grains randomly taken in the useful area of the plot, grain index - obtained as the ratio of pod grain weight and pod weight, grain yield - total yield in grams per plot area, transformed to kg/ha, cooking time, protein concentration, iron concentration, and zinc concentration. The data resulting of the scale of visual notes were transformed to  The cooking time was evaluated by the Mattson cooker, using a sample of 25 g of each population, which were soaked for 4 h, before determining this trait. The cooking time corresponded to the time when the 13th stick penetrated the grain, according to Proctor and Watts (1987) and Ribeiro et al. (2007).
For the accomplishment of the nutritional analyses, first, the flour was obtained by the grinding of 10 g of each population in the mill of zirconium balls. Then, the samples were submitted to a nitro-perchloric digestion and, subsequently, iron and zinc concentrations were determined using the atomic absorption spectrophotometer according to Sarruge and Haage (1974), using calibration curves of 0.5, 1.0, 2.0, and 4.0 mg/100 g for iron and 0.2, 0.4, 0.8, and 1.6 mg/100 g for zinc. Protein concentration analyses were performed by the Kjeldahl method (AOAC, 2005).
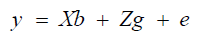
Statistical-genetic analyses were performed in the SELEGEN program (Resende, 2002) using mixed models and the REML/BLUE estimation method (restricted maximum likelihood/best linear unbiased estimation). The mixed linear model adopted was the following:
 (Equation 1)
where y = vector of observed data; X and Z = incidence matrices for b and g, respectively; b = vector of block effects (random); g = vector of genotypic (fixed) effects; e = vector of random error effects.
Due to the small number of treatments and because they did not belong to the same population, the effects of genetic materials were considered as fixed in the mixed linear model (Resende and Duarte, 2007). The presence of genetic variability among populations for the traits was evaluated by the Snedecor’s F value.
The genetic gain with the selection considering all the traits simultaneously was estimated only in the segregating populations, considering that these will be advanced and open lines in later generations. Three selection ind methodologies were used.
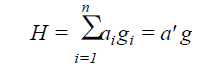
The classical index proposed by Smith (1936) and Hazel (1943) was obtained by the aggregate index (H), according to the equation:
 (Equation 2)
where n = number of traits evaluated; g = population effect for the n traits evaluated; a = effect of the economic weights previously established.
For the estimation of the classical index, different economic weights (0 to 1) and the direction of selection (increase and decrease) were adopted for each trait. The economic weight were: number of days to start flowering (0.10), number of days for maturity (0.12), plant type, plant lodging (0.02), cultivation value (0.02), pod length (0.02), number of grains per pod (0.05), weight of one hundred grains (0.15), grain yield (0.20), cooking time (0.02), and protein concentration (0.05). For the irection of selection, the increase of the traits were: value cultivation, pod length, the number of grains per pod, grain yield, grain index, and concentration protein; and the decrease of the traits were: the number of days to start flowering, the number of days for maturity, plant type, plant lodging, and cooking time.
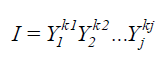
The multiplicative index proposed by Subandi et al. (1973) was estimated according to the equation:
 (Equation 3)
where I = selection index; Yj = overall mean of the trait j, where kj = 1, if considered the direct relation of the index with the trait, and kj = -1 if considered the inverse relation of the index with the trait.
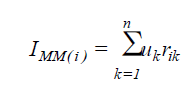
The index based on the sum of ranks proposed by Mulamba and Mock (1978) was calculated according to the equation:
 (Equation 4)
where IMM(i) = value of the Mulamba and Mock index associated with the population i; uk = economic weight of the trait k, being adopted the unity for all the traits; rik = ranks associated with the genotypic mean of the population i relative to the trait k.
For the estimative of the index sum of ranks, the direction of selection (increase or decrease) was informed.
Results and Discussion
Statistical analysis showed the existence of genetic variability among the 11 cowpea populations for all the traits, except for iron and zinc concentrations (Table 1).
The genotypic variation coefficient showed superiority in relation to the environmental variation coefficient for the number of days to start flowering (2.64%), plant type (9.53%), weight of one hundred grains (6.41%), grain index (3.48%), and protein concentration (3.24%) (Table 1), evidencing a situation favorable to the improvement of these traits. According to Vencovsky (1978), the largest portion of the phenotypic variation determined by genetic variations infers success in the selection process.
| Trait | Parameter | ||||
|---|---|---|---|---|---|
| GVC (%) | EVC (%) | g2 | F | OM | |
| NDSF (days) | 2.64 | 2.37 | 5.88** | 0.91 | 40.72 |
| NDM (days) | 1.05 | 1.48 | 3.03** | 0.82 | 57.89 |
| PT (note)1 | 9.53 | 5.72 | 12.50** | 0.96 | 1.65 |
| PLD (note)1 | 7.59 | 7.75 | 4.76** | 0.89 | 1.67 |
| CV (note)1 | 3.72 | 5.21 | 3.03** | 0.82 | 1.84 |
| PL (cm) | 5.41 | 5.59 | 4.76** | 0.89 | 21.18 |
| NGP (unity) | 6.23 | 8.48 | 3.13** | 0.83 | 14.14 |
| WHG (g) | 6.41 | 5.69 | 5.88** | 0.91 | 16.44 |
| GY (kg/ha) | 10.91 | 14.61 | 3.23** | 0.83 | 1330.43 |
| GI (%) | 3.48 | 3.28 | 5.56** | 0.90 | 77.55 |
| CT (min) | 10.01 | 10.17 | 4.76** | 0.89 | 11.80 |
| PC (%) | 3.24 | 2.82 | 5.00** | 0.89 | 26.14 |
| IC (mg/kg) | 1.33 | 3.89 | 1.35ns | 0.51 | 65.43 |
| ZC (mg/kg) | 2.28 | 5.01 | 1.60ns | 0.62 | 45.03 |
NDSF, number of days to start flowering; NDM, number of days for maturity; PT, plant type; PLD, plant lodging; CV, cultivation value; PL, pod length; NGP, number of grains per pod; WHG, weight of one hundred grains; GY, grain yield; GI, grain index; CT, cooking time; PC, protein concentration; IC, iron concentration; ZC, zinc concentration. OM, overall mean, nsnot significant, **significant at 1%, and 1value transformed to 
Table 1. Estimates of the parameters genotypic variation coefficient (GVC), environmental variation coefficient (EVC), genotypic determination coefficient (g2), and Snedecor’s F value (F) of 14 traits, evaluated in 11 cowpea populations.
The evaluated traits presented genotypic determination coefficient (g2) from the medium (cultivation value: 3.03) to the high magnitude (plant type: 12.50), except the iron and zinc concentrations, which presented low estimates, of 1.35 and 1.61, respectively. The moderate and high magnitude values of g2 showed that most of the traits presented good reliability of the phenotype in the selection of genotype. These results differed in part from those obtained by Mohammed et al. (2010), who studying six parental and five crosses of cowpea, found values from low to a moderate magnitude of this parameter.
The low magnitude of g2 for iron and zinc concentrations indicates the existence of high environmental influence, which makes it more difficult to select iron and zinc concentrations in the cowpea grain, also confirmed by low Snedecor’s F values and estimates of g2 that were not significant (Table 1). The low magnitude of g2 and high environmental influence for these characters were also found by Moura et al. (2012) and Costa (2013), who evaluating cowpea parental and crosses also found low estimates for this parameter.
The Snedecor’s F value presented median estimates only for the iron (0.51) and zinc (0.62) concentrations, while the other traits showed a high magnitude, ranging from 0.82 (cultivation value and number of days for maturity) to 0.91 (number of days to start flowering). This corroborates with the magnitudes of the estimates of g2, which showed greater variability for the agronomic and culinary traits and low variability of the nutritional traits, except the protein concentration. These results differed from those obtained by Costa (2013) for the iron concentration, which found high variability for this trait, studying a group of parental and two cowpea crosses.
According to the estimated genotypic values (BLUE) and considering the selection of the cowpea populations evaluated to increase the traits pod length, number of grains per pod, weight of one hundred grains, grain yield, grain index, protein concentration, iron concentration, and zinc concentration, as well as the decrease in number of days to start flowering, number of days for maturity, plant type, plant lodging, and cooking time, relevant gains will be obtained for a large number of traits, mainly BRS Xiquexique, IT-98K-205-8, IT-97K-1042-3, F4C31, F4C12, and F4BC12 populations, which presented the highest estimates (Table 2).
| Population | NDSF (days) | NDM (days) | PT2 (note) | PLD2 (note) | CV2 (note) | PL (cm) | NGP (unity) | |
|---|---|---|---|---|---|---|---|---|
| BRS Xiquexique | 41.58(10) | 58.46(10) | 1.75(9) | 1.79(10) | 1.81(8) | 22.39(1) | 15.82(1) | |
| IT-98K-205-8 | 38.67(1) | 57.12(1) | 1.45(2) | 1.46(1) | 1.93(2) | 20.00(11) | 13.26(11) | |
| IT-97K-1042-3 | 40.75(6) | 57.29(2) | 1.29(1) | 1.53(2) | 1.95(1) | 20.37(10) | 13.50(10) | |
| F4C12 | 39.91(2) | 58.13(9) | 1.70(5) | 1.58(3) | 1.83(7) | 21.06(8) | 14.21(4) | |
| F4C21 | 40.33(4) | 57.79(5) | 1.65(3) | 1.64(4) | 1.86(4) | 21.57(4) | 13.67(9) | |
| F4C13 | 41.37(9) | 58.13(8) | 1.76(10) | 1.81(11) | 1.87(11) | 21.11(7) | 13.91(6) | |
| F4C31 | 42.41(11) | 58.80(11) | 1.77(11) | 1.70(6) | 1.78(9) | 22.25(2) | 13.98(5) | |
| F4BC12 | 40.75(5) | 57.96(7) | 1.72(7) | 1.73(7) | 1.86(3) | 21.33(6) | 14.86(2) | |
| F4BC21 | 40.12(3) | 57.46(3) | 1.70(6) | 1.66(5) | 1.85(5) | 21.34(5) | 13.87(7) | |
| F4BC13 | 40.95(7) | 57.96(6) | 1.74(8) | 1.77(9) | 1.78(10) | 20.99(9) | 13.80(8) | |
| F4BC31 | 41.16(8) | 57.63(4) | 1.65(4) | 1.75(8) | 1.85(6) | 21.87(3) | 14.66(3) | |
| Population | WHG (g) | GY (kg/ha) | GI (%) | CT (min) | PC (mg/kg)1 | IC (mg/kg) | ZC (mg/kg) | |
| BRS Xiquexique | 17.68(1) | 1481.99(3) | 89.59(1) | 13.33(11) | 25.51(9) | 65.32(7) | 44.38(9) | |
| IT-98K-205-8 | 16.41(8) | 1181.57(10) | 78.40(5) | 11.03(3) | 25.90(6) | 64.87(11) | 44.92(6) | |
| IT-97K-1042-3 | 13.96(11) | 1155.35(11) | 71.92(11) | 11.78(7) | 28.04(1) | 65.63(3) | 45.52(3) | |
| F4C12 | 15.68(10) | 1279.06(7) | 77.18(7) | 9.94(1) | 26.13(5) | 65.39(6) | 46.17(1) | |
| F4C21 | 16.80(5) | 1306.07(6) | 76.76(8) | 11.36(4) | 26.44(4) | 65.597(4) | 45.30(5) | |
| F4C13 | 17.05(2) | 1268.83(8) | 75.50(10) | 10.93(2) | 26.44(3) | 65.82(2) | 44.27(11) | |
| F4C31 | 16.32(9) | 1251.87(9) | 76.56(9) | 13.19(10) | 26.61(2) | 66.42(1) | 45.74(2) | |
| F4BC12 | 16.80(4) | 1495.04(1) | 79.75(2) | 11.53(5) | 25.70(8) | 65.49(5) | 45.38(4) | |
| F4BC21 | 17.03(3) | 1391.32(4) | 78.69(4) | 12.02(8) | 25.42(11) | 64.88(10) | 44.74(7) | |
| F4BC13 | 16.57(6) | 1332.87(5) | 79.35(3) | 13.08(9) | 25.47(10) | 65.17(9) | 44.38(10) | |
| F4BC31 | 16.53(7) | 1490.80(2) | 78.03(6) | 11.58(6) | 25.83(7) | 65.19(8) | 44.53(8) |
1NDSF, number of days to start flowering; NDM, number of days to maturity; PT, plant type; PLD, plant lodging; CV, cultivation value; PL, pod length; NGP, number of grains per pod; WHG, weight of one hundred grains; GY, grain yield; GI, grain index; CT, cooking time; PC, protein concentration; IC, iron concentration; ZC, zinc concentration. 2Values transformed to  The index in parenthesis next to the BLUE estimates corresponds to the classification or ranking of the population based on the genetic gains.
Table 2. Estimated genotypic values - BLUE (µ+g) of 14 traits1 evaluated in 11 cowpea populations.
The F4C31, F4C13, and F4BC12 segregating populations were highlighted in BLUE values, surpassed only by the BRS Xiquexique parental (Table 2), Brazilian cultivar adapted to the region and with a high concentration of iron and zinc in the grain (Rocha et al., 2017). However, it did not show promising populations for all the traits analyzed simultaneously. This fact can be explained by the negative correlation between the production components and the nutritional traits (Table 3). These are populations obtained from the crosses involving the BRS Xiquexique Brazilian cultivar and the exotic African lines IT-98K-205-8 and IT- 97K-1042-3. It is important to mention the difference of adaptation between the lines and the cultivar, as well as to emphasize that among the traits evaluated there are those that are strongly influenced by the environment, such as grain yield and iron and zinc concentrations.
| Trait | NDM | PT2 | PLD2 | CV2 | PL | NGP | WHG | GI | GY | CT | PC | IC | ZC |
|---|---|---|---|---|---|---|---|---|---|---|---|---|---|
| NDSF | 0.76** | 0.48** | 0.74** | -0.65** | 0.81** | 0.46* | 0.15ns | 0.29ns | -0.06ns | 0.62** | 0.14ns | 0.72** | -0.13ns |
| NDM | 0.74** | 0.61** | -0.81** | 0.74** | 0.52** | 0.37* | 0.25ns | 0.24ns | 0.41* | -0.14ns | 0.68** | 0.12ns | |
| PT | 0.77** | -0.92** | 0.67** | 0.48* | 0.77** | 0.58** | 0.60** | 0.24ns | -0.65** | 0.20ns | -0.23ns | ||
| PLD | -0.80** | 0.74** | 0.61** | 0.62** | 0.67** | 0.40* | 0.46* | -0.42* | 0.23ns | -0.57** | |||
| CV | -0.67** | -0.36* | -0.57** | -0.35* | -0.35* | -0.35* | 0.42* | -0.37* | 0.27ns | ||||
| PL | 0.66** | 0.39* | 0.62** | 0.23ns | 0.47* | -0.17ns | 0.45* | -0.05ns | |||||
| NGP | 0.49** | 0.82** | 0.59** | 0.33* | -0.44* | -0.01ns | -0.22ns | ||||||
| WHG | 0.64** | 0.80** | 0.27ns | -0.81** | -0.18ns | -0.57** | |||||||
| GI | 0.72** | 0.27ns | -0.68** | -0.25ns | -0.37* | ||||||||
| GY | 0.31* | -0.95** | -0.46* | -0.38* | |||||||||
| CT | -0.17ns | 0.19ns | -0.36* | ||||||||||
| PC | 0.55** | 0.46* | |||||||||||
| IC | 0.40* |
1NDSF, number of days to start flowering; NDM, number of days for maturity; PT, plant type; PLD, plant lodging; CV, cultivation value; PL, pod length; NGP, number of grains per pod; WHG, weight of one hundred grains; GY, grain yield; GI, grain index; CT, cooking time; PC, protein concentration; IC, iron concentration; ZC, zinc concentration. 2Values transformed to x + 0.5 .
Table 3. Genotypic correlation coefficients estimated among 14 traits1 obtained from the evaluation of 11 cowpea populations.
The BRS Xiquexique population presented the highest gains for the production components and grain index (Table 2). The IT-98K-205-8 population had the highest gains for traits related to precocity (number of days to start flowering and number of days for maturity) and plant lodging. The IT-97K-1042-3 population obtained the highest gains for the traits related to the plant architecture and cultivation value. The F4C12 population presented the best classification for iron concentration and cooking time. The F4C31 population was highlighted in gain for the iron concentration. The F4BC12 population had a higher gain for grain yield.
Grain yield showed positive genotypic correlations, from medium to high magnitude with plant type (0.60), plant lodging (0.40), pod length (0.23), the number of grains per pod (0.59), the weight of one hundred grains (0.80), and grain index (0.72) (Table 3). This suggests the possibility of simultaneous gains for grain yield using an indirect selection of the plant type, plant lodging, pod length, number of grains per pod, the weight of one hundred grains, and grain index. These results corroborate with those obtained by Silva and Neves (2011), evaluating these correlations in 20 cowpea genotypes.
Negative correlations ranging from medium to high magnitude were observed between the protein concentration and the traits grain yield, number of grains per pod, pod length, the weight of one hundred grains, and grain index (Table 3). These results indicate that enhancement for these components may lead to decreases in protein concentration. These results corroborate with those obtained by Moura et al. (2012), studying the same populations, but in the F2 and F3 generations, but disagree with the results obtained by Santos and Boiteux (2013), which found positive correlation between protein concentration and grain yield, evaluating 87 lines derived from six cowpea crosses.
The correlations between the iron and zinc concentrations and the production and their components, in the great majority, were negative and from low to medium magnitude (Table 3), indicating that the breeder should be careful because the increase of the production traits can lead to decreases in the concentrations of these nutrients. These results were similar to those obtained by Ribeiro et al. (2014), evaluating the selection for grain yield and iron concentration in common bean, but different from those obtained by Santos and Boiteux (2013), who found a positive correlation between grain yield and iron and zinc concentrations, evaluating 87 F6 cowpea lines derived from six crosses.
The correlation coefficients between the traits related to the crop cycle (number of days to start flowering and number of days for maturity) and iron concentration and cooking time were positive and from medium to the high magnitude (Table 3). These correlations are indicative that the improvement for precocity leads to decreases in iron concentration and cooking time. According to Moura et al. (2012), the correlation between cooking time, number of days to start flowering, and number of days for maturity is favorable for obtaining early and fast cooking genotypes, which is currently emphasized in the cowpea breeding in Brazil (Freire Filho, 2011; Rocha et al., 2017).
The correlation between the weight of one hundred grains and grain index was positive and of high magnitude (Table 3), suggesting that the selection for the increase of grain size can lead to simultaneous gains for grain/pod ratio in cowpea. A similar result was obtained by Silva and Neves (2011), studying correlations between traits in 20 cowpea genotypes. The current market has demanded larger grains (Freire Filho, 2011) that together with a high grain index represent ideal conditions for producers and consumers.
Correlations between protein concentration and iron and zinc concentrations were positive and of medium magnitude (Table 3), indicating that simultaneous gains for these three traits can be obtained by selection. A similar sense of correlations was obtained by Santos and Boiteux (2013), evaluating 87 lines derived from six cowpea crosses.
The classical index of Smith (1936) and Hazel (1943) had the lowest expected genotypic gains with the selection, compared to the other indexes used (Table 4). This index highlighted the populations F4BC12, F4BC21, and F4C21 with the highest gains, 0.36, 0.33, and 0.29%, respectively, and therefore, are the ones with the greatest potential in simultaneous selection for precocity, erect plant, larger grain size, high grain yield, fast cooking time, and high protein, iron, and zinc concentrations.
The index sum of ranks (Mulamba and Mock, 1978) showed the highest gains with the simultaneous selection, with the F4BC12, F4C21, and F4C12 populations with percentage gains of 31.25, 29.90, and 23.53%, respectively (Table 4). According to Cruz et al. (2012), the index sum of ranks does not use variances and covariates between the characters. However, reliable estimation is not dependent on the availability of matrices of genetic and phenotypic variances and covariances. Besides, in this analysis, the populations were classified taking into account each of the traits, in order of improvement.
| Smith (1936) and Hazel (1943) | Mulamba and Mock (1978) | Subandi et al. (1973) | ||||
|---|---|---|---|---|---|---|
| Population | Gain (%) | Population | Gain (%) | Population | Gain (%) | |
| F4BC12 | 0.36 | F4BC12 | 31.25 | F4C31 | 15.69 | |
| F4BC21 | 0.33 | F4C21 | 29.90 | F4BC13 | 13.31 | |
| F4C21 | 0.29 | F4C12 | 23.53 | F4BC12 | 12.04 | |
| F4BC31 | 0.27 | F4BC21 | 19.43 | F4BC31 | 10.45 | |
| F4C12 | 0.20 | F4BC31 | 17.10 | F4BC21 | 7.84 | |
| F4BC13 | 0.14 | F4C31 | 10.53 | F4C13 | 5.36 | |
| F4C13 | 0.08 | F4C13 | 5.00 | F4C21 | 3.26 | |
| F4C31 | 0.00 | F4BC13 | 0.00 | F4C12 | 0.00 | |
1Number of days to start flowering, number of days to maturity, plant type, plant lodging, cultivation value, pod length, number of grains per pod, weight of one hundred grains, grain yield, grain index, cooking time, protein concentration, iron concentration, and zinc concentration.
Table 4. Estimates of genotypic gains with the simultaneous selection of 12 traits1 in eight cowpea F4 populations, using the three selection indexes.
Santos and Araújo (2001), Bertini et al. (2010), Silva (2015), Torres (2015), and Rodrigues et al. (2016), in studies on the application of selection indices in cowpea, reported that sum of ranks and multiplicative indexes presented satisfactory genetic gains with the simultaneous selection of traits. Jost (2011), studying the efficiency of the different selection indexes in common bean had different results to this one since the index sum of ranks showed inferior performance to the classical and multiplicative indexes. Marinho et al. (2014), comparing some selection indexes in common bean pre-commercial genotypes, also found lower efficiency for the index sum of ranks when compared to other selection indexes evaluated.
The multiplicative index (Subandi et al., 1973) presented moderate gains, relative to the indexes classical and the sum of ranks, highlighting the F4C31, F4BC13, and F4BC12 populations, which presented, respectively, genotypic gains of 15.69, 13.31, and 12.04% (Table 4). Contrary to this result, Jost (2011), using several selection indexes for to select common bean genotypes, found that the multiplicative and classical indexes were those that provided greater gains with the combined traits.
The different results found between the selection indexes adopted in this study, compared to the literature, suggest that an adequate index varies with the traits, species, and populations considered.
All the selection indexes used in this research indicated the cowpea segregating populations resulting from backcrossing (BRS Xiquexique x IT-98K-205-8) x BRS Xiquexique as very promising to obtain superior genotypes with simultaneous attributes of production, nutrition, and culinary in generations more advanced of endogamy.
Conclusion
The use of selection indexes allowed the identification of superior cowpea populations on the base of simultaneous selection of several traits. The index based on the sum of ranks provided the greatest genetic gains with the simultaneous selection of agronomic, nutritional, and culinary traits in the segregating cowpea populations evaluated, highlighting the F4BC12 population, with the best gain.
Conflicts of interest
The authors declare no conflict of interest.
Acknowledgments
We thank the BioFORT and HarvestPlus projects for financial support. Moreover, we thank the employees and trainees of the cowpea sector from Embrapa Meio-Norte, for the assistance in the implementation and conduction of the experiments.
About the Authors
Corresponding Author
M.M. Rocha
Embrapa Meio-Norte, Teresina, PI, Brasil
- Email:
- maurisrael.rocha@embrapa.br
References
- AOAC (2005). Official methods of analysis. 18th edn. AOAC, Washington.
- Bertini CHCM, Almeida WS, Silva APM, Lima LW, et al. (2010). Análise multivariada e índice de seleção na identificação de genótipos superiores de feijão-caupi. Acta Sci. Agron. 32: 613-619. https://doi.org/10.4025/actasciagron. v32i4.4631
- Carvalho AFU, Sousa NM, Farias DF, Rocha-Bezerra LCB, et al. (2012). Nutritional ranking of 30 Brazilian genotypes of cowpeas including determination of antioxidant capacity and vitamins. J. Food Compos. Anal. 26: 81-88. https:// doi.org/10.1016/j.jfca.2012.01.005
- Costa MM (2013). Potencial genético de populações segregantes para o teor de ferro e caracteres agronômicos em feijãocaupi. Masters’ theses. Universidade Federal do Piauí, Teresina. Available at [http://www.leg.ufpi.br/subsiteFiles/ ppgm/arquivos/files/Mariane(1).pdf].
- Cruz CD, Regazzi AJ and Carneiro PCS (2012). Modelos biométricos aplicados ao melhoramento genético. Editora UFV, Viçosa.
- Dias FTC (2009). Utilização de técnicas multivariadas e moleculares na caracterização e seleção de genótipos de feijãocaupi de porte ereto e ciclo precoce. Masters’ theses. Universidade Federal do Ceará, Fortaleza. Available at [http:// www.repositorio.ufc.br/bitstream/riufc/8490/1/2009_dis_ftcdias.pdf].
- Freire Filho FR (2011). Feijão-caupi no Brasil: produção, melhoramento genético, avanços e desafios. Embrapa Meio- Norte, Teresina.
- Hazel LN (1943). The genetic basis for constructing selection indexes. Genetics 28: 476-490.
- IFPRI (2016). Global Nutrition Report 2016: From promise to Impact: Ending Malnutrition by 2030. IFPRI, Washington. Available at [https://data.unicef.org/wp-content/uploads/2016/06/130565-1.pdf].
- Jost E (2011). Seleção de famílias de feijão baseada em caracteres agronômicos e de qualidade nutricional. Doctoral dissertation. Universidade Federal de Santa Maria, Santa Maria. Available at [http://cascavel.ufsm.br/tede/tde_ arquivos/4/TDE-2011-11-04T140946Z-3311/Publico/JOST,%20EVANDRO.pdf].
- Marinho CD, Gravina GA, Sebastião LCA, Almeida NC, et al. (2014). Indexes in the comparison of pre-commercial genotypes of common bean. Cienc. Rural 44: 1159-1165. https://doi.org/10.1590/0103-8478cr20121155
- Mohammed MS, Russom Z and Abdul SD (2010). Inheritance of hairiness and pod shattering, heritability and correlation studies in crosses between cultivated cowpea (Vigna unguiculata (L.) Walp.) and its wild (var. pubescens) relative. Euphytica 171: 397-407. https://doi.org/10.1007/s10681-009-0058-6
- Moura JO, Rocha MM, Gomes RLF, Freire Filho FR, et al. (2012). Path analysis of iron and zinc contents and other traits in cowpea. Crop Breed. Appl. Biotechnol. 12: 245-252. https://doi.org/10.1590/S1984-70332012000400003
- Mulamba NN and Mock JJ (1978). Improvement of yield potential of the Eto Blanco maize (Zea mays L.) population by breeding for plant traits. Egypt. J. Genet. Cytol. 7: 40-51.
- Proctor JR and Watts BM (1987). Development of a modified Mattson bean cooker procedure based on sensory panel cookability evaluation. Can. Inst. Food Sci. Technol. J. 20: 9-14. https://doi.org/10.1016/S0315-5463(87)70662-2
- Resende MDV (2002). Software Selegen - REML/BLUP. Embrapa Florestas, Colombo.
- Resende MDV and Duarte JB (2007). Precisão e controle de qualidade em experimentos de avaliação de cultivares. Pesq. Agropec. Trop. 37: 182-194.
- Ribeiro EdaS, Centeno DdaC, Figueiredo-Ribeiro RdeC, Fernandes KVS, et al. (2011). Free cyclitol, soluble carbohydrate and protein contents in Vigna unguiculata and Phaseolus vulgaris bean sprouts. J. Agric. Food Chem. 59: 4273-4278. https://doi.org/10.1021/jf104979m
- Ribeiro ND, Cargnelutti-Filho A, Poersch NL and Rosa SS (2007). Padronização de metodologia para avaliação do tempo de cozimento dos grãos de feijão. Bragantia 66: 335-346. https://doi.org/10.1590/S0006-87052007000200018
- Ribeiro ND, Rodrigues JA, Prigol M, Nogueira CW, et al. (2014). Evaluation of special grains bean lines for grain yield, cooking time and mineral concentrations. Crop Breed. Appl. Biotechnol. 14: 15-22. https://doi.org/10.1590/S1984- 70332014000100003
- Rocha MM, Damasceno-Silva KJ and Menezes-Júnior JAN (2017). Cultivares. In: Feijão-caupi: do plantio à colheita (Vale JC, Bertini C and Borém A, eds.). Editora UFV, Viçosa.
- Rodrigues EV, Damasceno-Silva KJ, Bastos EA, Rocha MM, et al. (2016). Seleção de populações de feijão-caupi tolerantes ao déficit hídrico por índice de seleção. In: Congresso Nacional de Feijão-caupi 4: 191.
- Santos CA and Araújo FP (2001). Aplicação de índices para seleção de caracteres agronômicos de feijão-de-corda. Rev. Cienc. Agron. 32: 78-84.
- Santos CAF and Boiteux LS (2013). Breeding biofortified cowpea lines for semi-arid tropical areas by combining higher seed protein and mineral levels. Genet. Mol. Res. 12: 6782-6789. https://doi.org/10.4238/2013.December.16.4
- Sarruge JR and Haage HP (1974). Análise química em plantas. ESALQ, Piracicaba.
- Silva JAL and Neves JA (2011). Componentes de produção e suas correlações em genótipos de feijão-caupi em cultivo de sequeiro e irrigado. Rev. Cienc. Agron. 42: 702-713. https://doi.org/10.1590/S1806-66902011000300017
- Silva JDL (2015). Seleção simultânea para desenvolvimento de linhagens de feijão-caupi de porte ereto e do tipo fradinho. Masters’ theses. Universidade Federal do Piauí, Teresina. Available at [http://www.leg.ufpi.br/subsiteFiles/ppgm/ arquivos/files/J%C3%A9ssica%20Daniele%20Lustosa%20da%20Silva.pdf].
- Smith HF (1936). A discriminant function for plant selection. Ann. Eugen. 7: 240-250. https://doi. org/10.1111/j.1469-1809.1936.tb02143.x
- Singh U, Praharaj CS, Chatur-Vedi SK and Bohra A (2016). Biofortification: introduction, approaches, limitations, challenges. In: Biofortification of food crops (Singh U, Praharaj CS, Singh SS and Singh NP, eds.). Springs, New Delhi.
- Subandi W, Compton A and Empig LT (1973). Comparison of the efficiencies of selection indices for three traits in two variety crosses of corn. Crop Sci. 13: 184-186.
- Torres MHRM (2015). Progresso genético com base na seleção simultânea de caracteres em linhagens elite de feijãocaupi. Masters’ theses. Universidade Federal do Piauí, Teresina. Available at [http://www.leg.ufpi.br/subsiteFiles/ ppgm/arquivos/files/Mario%20(2)(1).pdf].
- Vasconcelos IM, Maia FMM, Farias DF, Campello CC, et al. (2010). Protein fractions, amino acid composition and antinutritional constituents of high-yielding cowpea cultivars. J. Food Compos. Anal. 23: 54-60. https://doi. org/10.1016/j.jfca.2009.05.008
- Vencovsky R (1978). Effective size of monoecious populations submitted to artificial selection. Rev. Bras. Genet. 1: 181- 191.
- Williams JS (1962). The evaluation of a selection index. Biometrics 18: 375-393. https://doi.org/10.2307/2527479
Keywords:
Download:
Full PDF- Share This