Genetic variants in exon 1 region of FABP3 gene in relation to milk production traits in Sahiwal and Karan Fries cattle
Received: April 07, 2018
Accepted: September 01, 2018
Published: November 05, 2018
Genet.Mol.Res. 17(4): http://dx.doi.org/gmr16039928
DOI: http://dx.doi.org/10.4238/gmr16039928
Abstract
The present study pertained to records on milk production and milk constituents of 100 Sahiwal cattle and 115 Karan Fries cattle, the data collected over a period of 2004 to 2016 from Animal Genetics and Breeding division from ICAR-National Dairy Research Institute, Karnal, Haryana. In Sahiwal SNP at position G649C was found to be highly associated with FLTMY and FL305DFY and however the association was non-significant for FL305DMY, FL305DSNFY and FL305DPY. GC genotype was superior with respect to FL305DPY and FL305DFY traits, whereas, homozygous (GG) genotype was superior for rest of other traits. In Karan Fries SNP at position G649C was found to be highly associated with FL305DFY and however, the association was non-significant for FL305DMY, FLTMY, FL305DSNFY and FL305DPY. Heterozygote GC genotype was superior for all traits; however the superiority is significantly higher for FL305DFY traits in present study.
Keywords
Sahiwal and Karan Fries cattle; FABP3 gene; Milk constituent’s traits
Introduction
India is a rich reservoir of genetic diversity in cattle with 41 recognized cattle breeds. The total number of cattle population was 190.90 million (37.28% of total livestock population) out of which indigenous cattle population comprised of 151.17 million (Livestock Census, 2012). As far as milk production is concerned Sahiwal is the best dairy breed of the Indian subcontinent. The Karan Fries breed has been evolved from crossbreeding between Tharparkar and Holstein Friesian at the ICAR-National Dairy Research Institute, Karnal, Haryana. The FABPs (Fatty Acid Binding Proteins) are 14-15 kDa protein that reversibly binds non-esterified saturated and unsaturated long-chain fatty acids, eicosanoids and other lipids with the purpose of transporting or storing them inside a cell (Shimano H et al., 1996). There are nine members of the FABPs protein family that are expressed differentially in multiple tissues. The most abundant isoforms of FABPs expressed in the lactating bovine mammary gland are FABP3, FABP4 and FABP5 (Jensen RG, 2002). The FABP3 protein, also known as ‘heart FABP’, is expressed in tissues such as heart, skeletal muscle, mammary gland, brown adipose tissue and other tissues (Shimano H et al., 1996). The main function of FABP3 is to channel fatty acids inside a cell towards mitochondrial β-oxidation in heart and skeletal muscles. The discovery of FABP3 protein in mammary gland was related to the identification of a Mammary Derived Growth Inhibitor (MDGI) that turned out to be a mixture of FABP3 and FABP4 proteins (Yang T et al., 2002); (German JB and Dillard CJ, 2006). The FABP3 protein is highly expressed in the mammary gland during cell differentiation and formation of ductal structures at the onset of lactation (Binas B et al., 1992), but the requirement of FABP3 for mammary tissue development and function is not well established (Schaefer EJ, 2002; Stoop WM et al., 2008). The FABP3 highly expressed in bovine mammary gland during lactation and being the second most abundant transcript among all measured. The polymorphisms in FABP3 genes affect the selectivity of fatty acid uptake from the blood and fatty acid transport inside the mammary epithelial cells, resulting in differences in milk fatty acid composition (Jensen RG, 2002; Soyeurt H et al., 2006).
Material and Methods
Experimental animals and genomic DNA isolation
The data for present study pertained to various milk production and milk constituents traits were collected from history sheets and milk constituents registers, data on milk production and milk constituents records of 100 Sahiwal and 115 Karan Fries cattle with spread over a period of 13 years from 2004 to 2016 were collected from Animal Genetics and Breeding division of ICAR-National Dairy Research Institute, Karnal, Haryana. Blood samples were collected from the selected population. About 10 ml of venous blood was collected aseptically from the jugular vein of the animals in a 15ml polypropylene centrifuge tube under sterile condition using 0.5 ml of EDTA as an anticoagulant. The tube was shaken gently to facilitate thorough mixing of blood with the anticoagulant. The tubes containing blood samples were transported to the laboratory as soon as possible in an icebox containing ice packs and were stored in the refrigerator at –20°C temperature until the isolation of DNA was done. Phenol extraction method as described by Sambrook and Russell (Sambrook J and Russell DW, 2001) was used for isolation of genomic DNA. Horizontal submarine agarose gel electrophoresis was used to check the quality of genomic DNA. The purity of genomic DNA was checked by spectrophotometer. The 6 µl of genomic DNA of each sample was dissolved in 294 µl of triple distilled water and spectrophotometer readings at OD260 and OD280 was recorded against 300 µl double distilled water as a blank. Genomic DNA samples showing the OD ratio in the range of 1.7 to 1.9 was used further in the study.
Amplification of targeted region of AAT genes
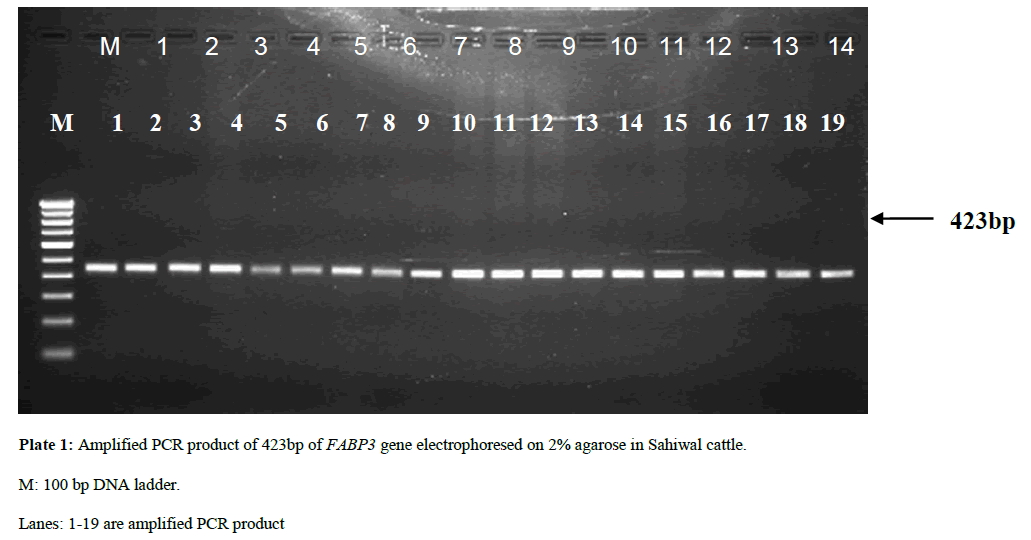
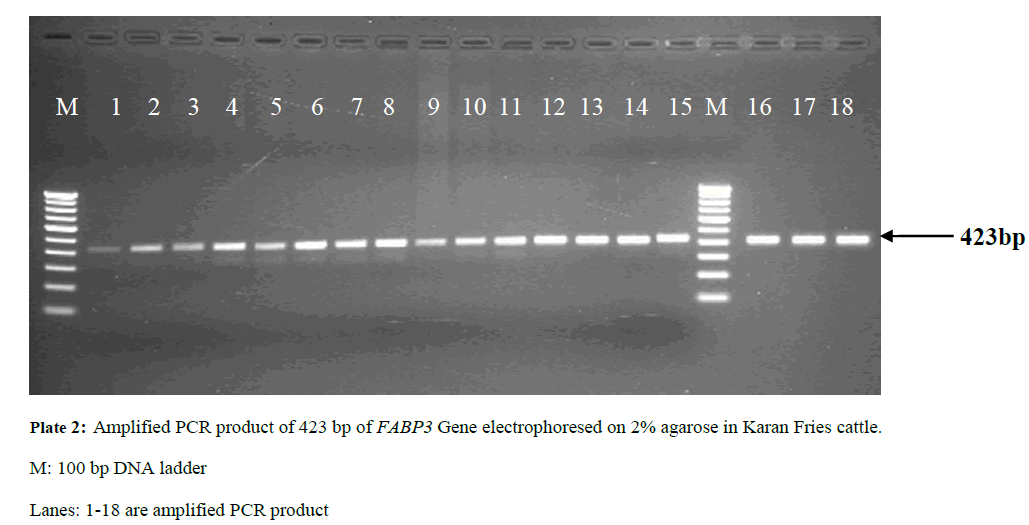
Only good quality genomic DNA was used for amplification of Exon 1 of FABP3 gene (423bp) by polymerase chain reaction under optimized conditions.
F: 5’ -CTGACGTAGGCAAACTGGGT -3’
R: 5’- CATGCAGGATCTAGCCAGGG -3’
Primers (F) and (R) was used to amplify Exon 1 region of FABP3 gene, which were designed to amplify genes using Primer 3 software (http://www.primer3.ut.ee) (Untergasser A et al., 2012) and gene sequence available at NCBI database (http://www.ncbi.nlm.nih.gov). The primers designed were checked for specificity by BLAST (version 1.2.0). Primers were designed and synthesized from Sigma Aldrich Chemicals Pvt.Ltd (USA), the best amplification of the desired fragment was taken for further analysis. The standard programme is given as under (Table 1):
| Components | Concentration | Volume (µl) |
|---|---|---|
| 1. 10x Buffer | 10 X | 2.5 |
| 2. 1 5 mM MgCl2 | 15 mM | 1.5 |
| 3. d NTP’s | 200 µM | 0.5 |
| 4. F-primer | 30 pm | 3.0 |
| 5. R-primer | 30 pm | 3.0 |
| 6. Taq (5 units/µl) | 1 unit | 0.2 |
| 7. Template | 100 ng | 1.0 |
| 8. Distilled water | -- | 14.3 |
Table 1: The standard programme for PCR Reaction mix (25 μl).
Polymerase chain reaction amplification of exon 1 region of FABP3 genes
Various annealing temperatures were tried for PCR amplification of FABP3 genes. Total volume of 25 µl for each sample was used to set up the PCR reactions. The set of primer was used to amplify target regions of FABP3 genes in Sahiwal and Karan Fries cattle. The best results were obtained when amplification wasperformed in PCR thermal cycler (Eppendorf Germany) programmed for 32 cycles with an initial denaturation at 94°C for 05 minutes, denaturation at 94°C for 30 second, annealing at 62°C for 30 second and extension at 72°C for 30 second with a final extension at 72°C for 10 minutes.
Agarose gel electrophoresis of polymerase chain reaction product
The amplified product was checked for quality and quantity by agarose gel electrophoresis as described by Sambrook and Russell, 2001. Total 5 µl of amplified PCR product of each sample was mixed with 1 µl of 6x gel loading dye buffer from each tube. The samples were loaded on 2% agarose gel containing ethidium bromide (1% solution @ 5 µl /100 ml) along with 100 bp DNA ladder (O’GeneRuler™-Fermentas) at a constant voltage of 70V for 45 minutes in 0.5x TBE buffer. The amplified PCR product on agarose gel was visualized as a single compact band of different primers size under UV trans-illuminator and documented by photograph through gel documentation system (Bio-Rad, USA) (Plates 1 and 2).
Sequenced data analysis for SNPs detection
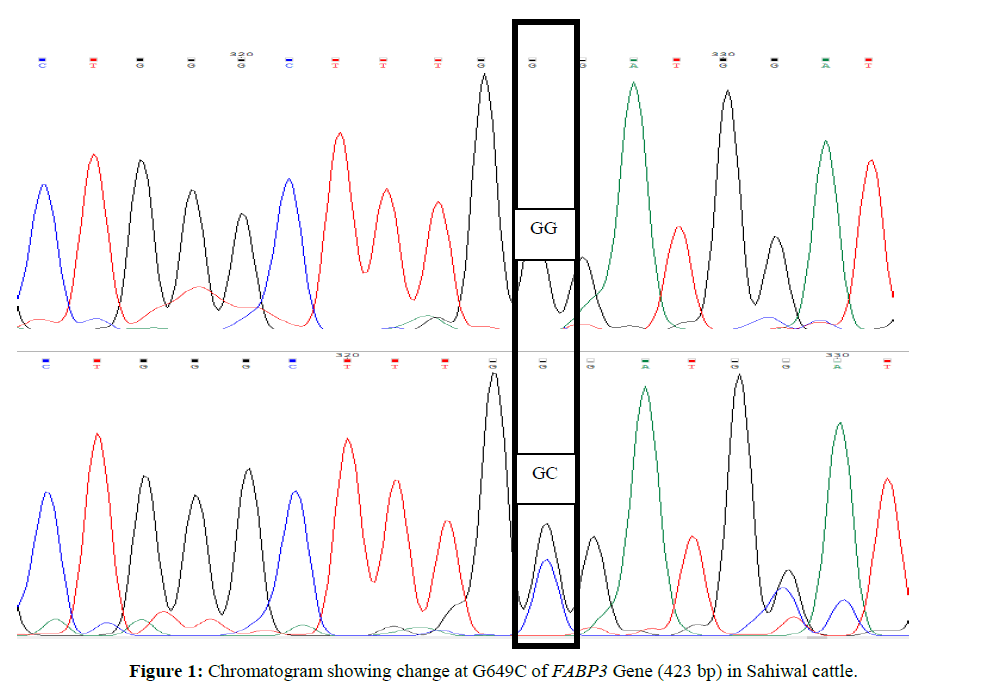
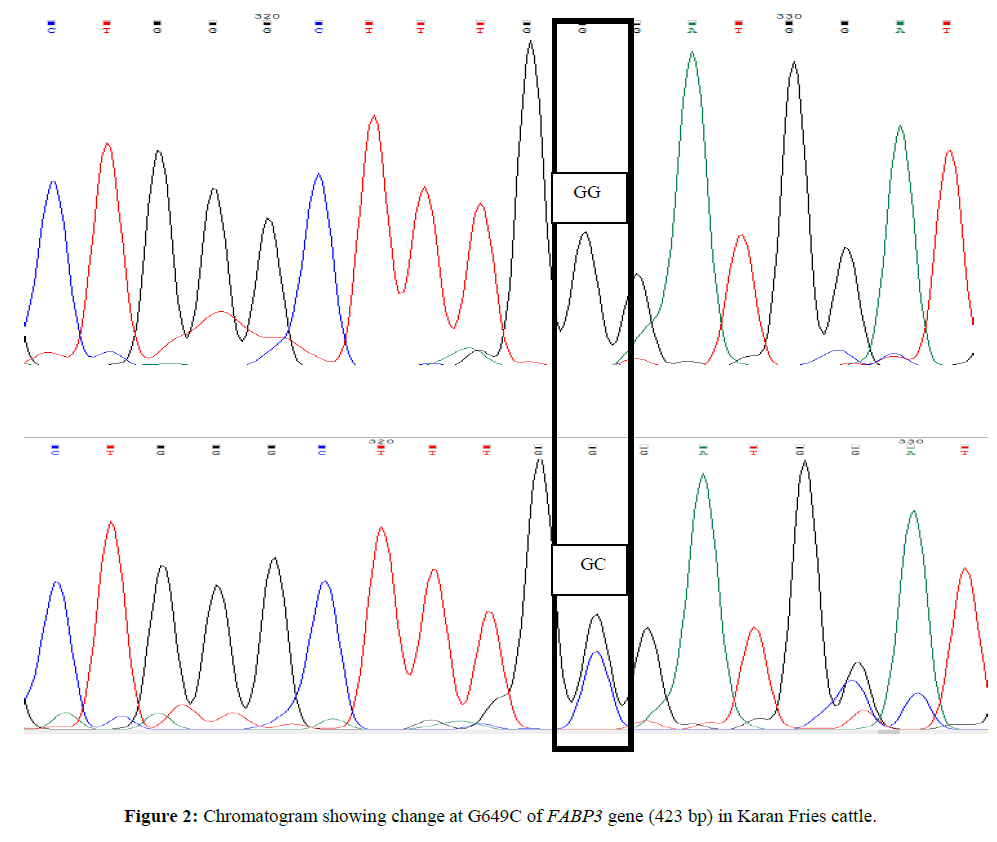
For custom sequencing ten amplicons of different sizes were sent to 1st BASE Sequencing INT by using forward and reverse primers and the final sequences of each contig for Sahiwal and Karan Fries cattle were deduced from the raw sequences by using Bioedit software. Amplified PCR products were sequenced and after Clustal W analysis (www.ebi.ac.uk/tools/msa/clustalw2) (Larkin MA,et al., 2007). ClustalW software was used for determining the SNPs in which complete coding sequence of animal were compared and aligned with the edited sequences of other Sahiwal and Karan Fries cattle (Figures 1 and 2).
Statistical analysis of PCR-RFLP data
The analysis was carried out with appropriate Statistical method using software’s in the computer centre of the institute under the following headings:
Restricted Maximum Likelihood Method (REML)
Estimation of breeding value: The single trait animal model was considered for estimation of breeding value using WOMBAT software (Meyer K 2010). The following animal model was considered:
| Yijk = X bi + Z uj + eijk | |
| Where, | |
| Yijk | = kth observation of jth random effect of ith fixed effect |
| bi | = Vector of observation of fixed effect |
| X | = Incidence matrix of fixed effect |
| uj | = Vector of additive genetic effect (Animal effect) |
| Z | = Incidence matrix of random effect |
| eijk | = Vector of residual errors |
Association estimation: Based on the adjusted records, pertaining to milk yield and its constituents on Sahiwal and Karan Fries cattle maintained at ICAR-NDRI, Karnal, regression analysis was carried out to identify SNPs contributing significantly to the variation in milk and its constituents.:
| Yijk= a + biSNPi+ bjSNPj +…..bnSNPn+ eijk | ||
| where, | ||
| Yijk | = | Adjusted observation on kth animal of ith , jth….nth SNPs |
| a | = | Intercept |
| bi …n | = | Partial regression coefficient for SNPs considered |
| SNPi,j...n | = Effect of SNPs taken as independent variable | |
| eijk | = | Random error NID (0, σ2e) |
Effect of genotypes on breeding value: The relative contribution of Genotypes to breeding value of the animal for milk yield and milk constituents was assessed using the following model:
Yij = µ + Gi +eij |
|
| where, | |
| Yij | = Breeding value of jth animal of ith genotype |
| m | = Overall mean |
| Gi | = Effect of ith genotypes (SNPs/haplotypes) |
| eij | = Residual error NID (0, σ2e) |
Results and Discussion
Genetic variant (SNP) at G649C location of exon 1 of FABP3 Gene (423 bp) in Sahiwal. In Sahiwal SNP at position G649C was found to be highly associated with first lactation total milk yield (FLTMY) and First Lactation 305 day’s fat yield (FL305DFY) and however the association was non-significant for First Lactation 305-days milk yield (FL305DMY), First Lactation 305 days SNF yield (FL305DSNFY) and First Lactation 305 days protein yield (FL305DPY). The mean ± SE of GG genotype for FL305DMY, FLTMY, FL305DFY, FL305DSNFY, FL305DPY were found to be 1827.7 ± 12.8, 2039.2 ± 12.7, 97.63 ± 0.42, 155.06 ± 0.14 and 43.85 ± 0.12 respectively in the present study and for Heterozygous (GC) genotype were 1802.24 ± 8.37, 1998.61 ± 8.31, 101.50 ± 0.28, 154.81 ± 0.09 and 43.92 ± 0.08 respectively (Tables 2 and 3). GC genotype was superior with respect to FL305DPY and FL305DFY traits, whereas, homozygous (GG) genotype was superior for rest of other traits. The result is also in agreement with Kulig et al., 2010 and reported AA genotypes were characterized by a significantly 0.08% higher protein content in milk than AG and 0.07% higher than GG genotypes. Milk fat content in AA cows was significantly higher compared with AG and GG cows by 0.31 and 0.46 % respectively. AG cows were characterized by a significantly 0.15% higher fat content than GG cows. Out of total variability in fat 4.2% was explained by FABP3 polymorphism, protein 2.2% by FABP3 genotype. FABP3 significantly affects fat and protein content in Jersey cow with A as a desirable allele for improvingthese traits. FABP3 gene can be considered marker for milk production traits. Nafikovet et al., 2013 reported overall haplotype effect of FABP3 was associated significantly with the concentrations of only pentadecylic (15:0) acid and elongation index.
| Source | df | SS | MSS | F-value |
|---|---|---|---|---|
| FL305D MY | ||||
| SNP G649C | 1 | 13652 | 13652 | 2.79 |
| Error | 98 | 480149 | 4899 | |
| Total | 99 | 493801 | ||
| FLTMY | ||||
| SNP G649C | 1 | 34554 | 34554 | 7.15** |
| Error | 98 | 473800 | 4835 | |
| Total | 99 | 508355 | ||
| FL305DFY | ||||
| SNP G649C | 1 | 314.82 | 314.82 | 56.89** |
| Error | 98 | 542.27 | 5.53 | |
| Total | 99 | 857.09 | ||
| FL305DSNFY | ||||
| SNP G649C | 1 | 1.33 | 1.33 | 2.28 |
| Error | 98 | 57.55 | 0.58 | |
| Total | 99 | 58.89 | ||
| FL305DPY | ||||
| SNP G649C | 1 | 0.11 | 0.11 | 0.23 |
| Error | 98 | 46.84 | 0.47 | |
| Total | 99 | 46.95 | ||
**Highly significant (p<0.01)
Table 2: ANOVA for SNP G649C of FABP3 gene in Sahiwal cattle.
| SNP G649C | N | Mean (Kg) ± SE |
|---|---|---|
| FL305DMY | ||
| GC | 70 | 1802.24 ± 8.37 |
| GG | 30 | 1827.7 ± 12.8 |
| FLTMY | ||
| GC | 70 | 1998.61 ± 8.31a |
| GG | 30 | 2039.2 ± 12.70b |
| FL305DFY | ||
| GC | 70 | 101.50 ± 2.81a |
| GG | 30 | 97.63 ± 4.29b |
| FL305DSNFY | ||
Table 3: Least square mean and standard error for milk production traits.
Regression equation: The significance of association of SNP with different performance traits were estimated by constructing the regression equation and the best fit equation for each of them is given below:
FL305DMY = 1814.99 – 12.75 SNP_GC + 12.75 SNP_GG (R2 =2.76)
FLTMY = 2018.89 – 20.28 SNP_GC + 20.28 SNP_GG (R2 =6.80 )
FL305DFY = 99.56 + 1.93 SNP-GC – 1.93 SNP_GG (R2 = 36.73)
FL305DSNFY = 154.94 – 0.12 SNP_GC + 0.12 SNP_GG (R2 =2.27)
FL305DSNFY = 154.94 – 0.12 SNP_GC + 0.12 SNP_GG (R2 =2.27)
Genetic variant at SNP G649C location in exon 1 of FABP3 gene in Karan Fries cattle
SNP at position G649C was found to be highly associated with FL305DFY and however the association was non-significant for FL305DMY, FLTMY, FL305DSNFY and FL305DPY. The mean ± SE of homozygous (GG) genotype for FL305DMY, FLTMY, FL305DFY, FL305DSNFY, FL305DPY were found to be 3513.50 ± 10.7, 4533.30 ± 10.7, 97.75 ± 3.81, 278.04 ± 0.10 and 113.25 ± 0.10 respectively in the present study and for Heterozygous GC genotype ware 3429.23 ± 8.59, 4549.44 ± 8.59, 159.75 ± 3.05, 278.19 ± 0.08, 113.48 ± 0.08 respectively (Tables 4 and 5). Heterozygote GC genotype was superior for all traits; however the superiority is significantly higher for FL305DFY traits in present study. The result is also in agreement with Kulig et al., 2010 and reported AA genotypes were characterized by a significantly 0.08% higher protein content in milk than AG and 0.07% higher than GG genotypes. Milk fat content in AA cows was significantly higher compared with AG and GG cows by 0.31 and 0.46 % respectively. AG cows were characterized by a significantly 0.15% higher fat content than GG cows. Out of total variability in fat 4.2% was explained by FABP3 polymorphism, protein 2.2% by FABP3 genotype. FABP3 significantly affects fat and protein content in Jersey cow with A as a desirable allele for improving these traits. FABP3 gene can be considered marker for milk production traits. Nafikovet et al. 2013 reported overall haplotype effect of FABP3 was associated significantly with the concentrations of only pentadecylic (15:0) acid and elongation index.
| Source | df | SS | MSS | F-value |
|---|---|---|---|---|
| FL305D MY | ||||
| G649C | 1 | 7144 | 7144 | 1.38 |
| Error | 113 | 583867 | 5167 | |
| Total | 114 | 591011 | ||
| G649C | 1 | 7144 | 7144 | 1.38 |
| Error | 113 | 583867 | 5167 | |
| Total | 114 | 591011 | ||
| FL305DFY | ||||
| G649C | 1 | 105293.60 | 105293.60 | 161.39** |
| Error | 113 | 7372.20 | 652.40 | |
| Total | 114 | 179015.81 | ||
| G649C | 1 | 0.64 | 0.64 | 1.29 |
| Error | 113 | 56.31 | 0.49 | |
| Total | 114 | 56.95 | ||
| FL305DPY | ||||
| G649C | 1 | 1.34 | 1.34 | 2.50 |
| Error | 113 | 60.62 | 0.53 | |
| Total | 114 | 61.97 | ||
**Highly significant (p<0.01)
Table 4: ANOVA for SNP G649C of FABP3 Gene in Karan Fries
| N | Mean (Kg) ± SE | |
|---|---|---|
| G649C | ||
| FL305DMY | ||
| GC | 70 | 3529.68 ± 8.59 |
| GG | 45 | 3513.50 ± 10.70 |
| FLTMY | ||
| GC | 70 | 4549.44 ± 8.59 |
| GG | 45 | 4533.3 ± 10.70 |
| FL305DFY | ||
| GC | 70 | 159.75 ± 3.05a |
| GG | 45 | 97.75 ± 3.81b |
| FL305DSNFY | ||
| GC | 70 | 278.19 ± 8.40 |
| GG | 45 | 278.04 ± 10.50 |
| FL305DPY | ||
| GC | 70 | 113.48 ± 8.80 |
| GG | 45 | 113.25 ± 10.90 |
Table 5: Least square mean and standard error for milk production traits.
Conclusion
In Sahiwal SNP at position G649C was found to be highly associated with FLTMY and FL305DFY. GC genotype was superior with respect to FL305DPY and FL305DFY traits, whereas, homozygous (GG) genotype was superior for rest of other traits. In Karan Fries cattle SNP at position G649C was found to be highly associated with FL305DFY. Heterozygote GC genotype was superior for all traits; however the superiority is significantly higher for FL305DFY traits in present study.
About the Authors
Corresponding Author
Alok Kumar Yadav
Division of Animal Genetics and Breeding, ICAR-National Dairy Research Institute, Karnal-132001, Haryana, India
- Email:
- alokvet1000@gmail.com
References
- Binas B, Spitzer E, Zschiesche W, Erdmann B, et al. (1992) Hormonal induction of functional differentiation and mammary derived growth inhibitor expression in cultured mouse mammary gland explants: In Vitro Cell Dev Biol 28A: 625-634. https://doi.org/10.1007/bf02631038
- German JB and Dillard CJ (2006) Composition, structure and absorption of milk lipids: A source of energy, fat soluble nutrients and bioactive molecule: Critical Reviews. Food Sci Nutr 46: 57-92. https://doi.org/10.1080/10408690590957098
- Jensen RG (2002) The composition of bovine milk lipids. J Dairy Sci 85: 295-350. https://doi.org/10.3168/jds.s0022-0302(02)74079-4
- Kulig H, Kowalewska-Łuczak I, Kmiec M, Wojdak-Maksymiec K (2010) ANXA9, SLC27A3, FABP3 and FABP4 single nucleotide polymorphisms in relation to milk production traits in Jersey cows. Czech J Anim Sci 55:463–467. https://doi.org/10.17221/1712-cjas
- Livestock Census (2012) The 19th All India Livestock Census. Department of Animal husbandry, Dairying and Fisheries. Ministry of agriculture. Government of India.
- Larkin MA, Blackshields G, Brown NP, Chenna R, et al. (2007). ClustalW and ClustalX version 2.0. Bioinform 23: 2947–2948. https://doi.org/10.1093/bioinformatics/btm404
- Meyer K (2010) WOMBAT—A tool for mixed model analyses in quantitative genetics by restricted maximum likelihood (REML). J Zhejiang Univ Sci 8: 815-821. https://doi.org/10.1631/jzus.2007.b0815
- Nafikov RA, Schoonmaker JP, Kathleen TK, Kristin N, et al. CB (2013). Effects of polymorphisms in FABP3, FABP4, and SLC27A6 genes on bovine milk fatty acid composition. J Dairy Sci 96: 6007-21.
- Sambrook J and Russell DW (2001) Molecular cloning. A laboratory manual 3rd Edn. Cold Pring Harbor Laboratory Press, New York. https://q9aktlv4iv908.storage.googleapis.com/EgNoUteio8nnVxXqwK08.pdf
- Schaefer EJ (2002). Lipoproteins, nutrition, and heart disease. Am J Clin Nutr 75: 191-212. https://doi.org/10.1093/ajcn/75.2.191
- Shimano H, Horton JD, Hammer RE, Shimomura I, et al. (1996) Overproduction of cholesterol and fatty acids causes massive liver enlargement in transgenic mice expressing truncated SREBP-1a. J Clin Invest 98: 1575- 1584. https://doi.org/10.1172/jci118951
- Soyeurt H, Dardenne P, Gillon A, Croquet C, et al. (2006)Variation in fatty acid contents of milk and milk fat within and across breeds. J Dairy Sci 89: 4858-4865. https://doi.org/10.3168/jds.s0022-0302(06)72534-6
- Stoop WM, Van-Arendonk JA., Heck JM, Van-Valenberg HJ, et al. (2008) Genetic parameters for major milk fatty acids and milk production traits of Dutch Holstein-Friesians. J Dairy Sci 91: 385-394. https://doi.org/10.3168/jds.2007-0181
- Untergasser A, Cutcutache I, Koressaar T, Ye J, et al. (2012) Primer3- new capabilities and interfaces. Nucleic Acids Res 40: 115. https://doi.org/10.1093/nar/gks596
- Yang T, Espenshade PJ, Wright ME, Yabe D, et al. (2002). Crucial step in cholesterol homeostasis: sterols promote binding of SCAP to INSIG-1, a membrane protein that facilitates retention of SREBPs in ER. Cell 110: 489-500.
Keywords:
Download:
Full PDF- Share This


