Expression of lipid metabolism and myosin heavy chain genes in pigs is affected by genotype and dietary lysine
Received: March 08, 2018
Accepted: April 10, 2018
Published: April 16, 2018
Genet.Mol.Res. 17(2): gmr16039904
DOI: 10.4238/gmr16039904
Abstract
Expression of lipid metabolism and myosin heavy chain genes was evaluated in skeletal muscle of pig’s genotypes submitted to different dietary digestible lysine contents. Fifty-two barrows and fifty gilts from three genotypes (G: Piau, Duroc and Pietrain crossbreds) were assigned to three dietary digestible lysine contents (DL: Low, Medium and High). Ten genes were evaluated, being six involved with lipid metabolism: Fatty acid synthase (FAS), Stearoyl-CoA desaturase (SCD), Protein kinase AMP-activated γ1 subunit (PRKAG1), Protein kinase AMP-activated γ3 subunit (PRKAG3), Hormone sensitive lipase (HSL), Heart fatty acid-binding protein (H-FABP), and four in Myosin heavy chain: MyHC I, MyHC IIa, MyHC IIb and MyHC IIx. There were no G × DL interactions. The expression levels for FAS, SCD, PRKAG1, HFABP, MyHC IIb and MyHC IIa were affected by G (P<0.05). A higher expression were observed for FAS in Pietrain barrows and gilts (P<0.05); for SCD in Duroc barrows, and in Duroc and Pietrain gilts (P<0.05); for PRKAG1 in Piau barrows and gilts (P<0.05); for H-FABP and MyHC IIb in Duroc and Pietrain barrows (P<0.05); and for MyHC IIa in Duroc and Pietrain gilts (P<0.05). The expression levels for MyHC IIb, PRKAG3 and MyHC IIa were affected by DL (P<0.05). A higher ex’pression were observed for MyHC IIb in barrows fed High and Medium DL, and in gilts fed High DL (P<0.05); for PRKAG3 in barrows fed Low DL (P<0.05); and for MyHC IIa in gilts fed High DL (P<0.05). Our results indicate that genotype and dietary lysine appear to affect the expression of lipid metabolism and myosin heavy chain genes of barrows and gilts in different ways.
Introduction
Although it is well known that different pig breeds differ in carcass and meat quality traits (Ruusunen et al., 2012; Shen et al., 2014) the molecular mechanisms underlying these differences remain unclear. Usually, differences in meat quality traits are smaller between commercial pig breeds, because the goals of pig breeding, such as fast growth and leanness of the carcass have been similar for a long time (Ruusunen et al., 2012).Conversely, local breeds such Piau, exhibits decreased growth rate and greater fat content (Serão et al., 2011) compared to commercial pig breeds.
Fat accretion may be affected by dietary lysine content because lysine plays a pivotal role in regulating energy metabolism in the skeletal muscle without compromise growth rate of pigs (Katsumata, 2011; Katsumata et al., 2012). The extent of fat deposition in skeletal muscles varies according to the balance between triglycerides synthesis, fat mobilization, fatty acid transport as well as fatty acid oxidation (Zhao et al., 2009). These mechanisms involve lipogenic genes such as fatty acid synthase (FAS) and stearoyl-CoA desaturase (SCD) (Doran et al., 2006), lipolytic genes as hormone-sensitive lipase (HSL) (Moro et al., 2008) and fatty acid transporting gene such as heart fatty-acid binding protein (H-FABP) (Jurie et al., 2007).
Another factor that may affect the intramuscular fat deposition is the skeletal muscle fiber metabolism. Skeletal muscle fibers in pigs are categorized into four types, based on abundance of myosin heavy chain (MyHC) ATPase: MyHC I (slow-oxidative), MyHC IIa (fast-oxidative), MyHC IIx (intermediary to MyHC IIa and MyHC IIb) and MyHC IIb (fast-glycolytic). Intramuscular fat is positively correlated with percentage of oxidative muscle fiber, but negatively correlated with glicolytic muscle fiber. Additionally, among the molecular mechanisms underlying variation of pork quality, the composition of skeletal muscle fibers appears as one of the main factors determining differences in biochemical pathways of the conversion of muscle into meat (Guo et al., 2011), and may also affect meat quality traits such as color and water holding capacity.
Therefore, in this study we aimed to evaluate the effects of the genotype (Piau, Duroc and Pietrain crossbreds) and dietary digestible lysine contents (Low, Medium and High) on the mRNA expression of genes involved in lipid metabolism and myosin heavy chain.
Materials and Methods
Animal handling procedures were performed in accordance with the regulations approved by the Institutional Animal Welfare and Ethics/Protection commission (Protocol nº 20/2014) from the Universidade Federal de Viçosa, Viçosa, Minas Gerais, Brazil.
Genotypes and dietary lysine
A total of 52 barrows averaging 25.44 ± 3.27 kg of initial body weight and 50 gilts averaging 24.14 ± 3.87 kg of initial body weight at 70 days of age were used and each animal was considered as an experimental unit. Piau Brazilian local breed, Duroc-based line and Pietrain breed were used as sires. Thus, the barrows genotype was composed of 18 Piau crossbred pigs [G1=Piau male × (Pietrain × Large White female)], 18 Duroc crossbred pigs [G2=Duroc-based male × (Pietrain × Large White female)], and 16 Pietrain crossbred pigs [G3=Pietrain male × (Pietrain × Large White female)]. The gilts genotype was composed of 16 Piau crossbred pigs (G1), 18 Duroc crossbred pigs (G2), and 16 Pietrain crossbred pigs (G3).
Pigs from each genotype (G1, G2 and G3) were randomly assign to one of the three dietary lysine contents based on predicted daily digestible lysine (DL) as it follows: Low (7 g DL fed from 70 to 98 days of age; 6 g DL fed from 99 to 134 days of age; and 5 g DL 135 to 156 days of age), Medium (9 g DL fed from 70 to 98 days of age; 8 g DL fed from 99 to 134 days of age; 7 g DL 135 to 156 days of age), and High (11 g DL fed from 70 to 98 days of age; 10 g DL fed from 99 to 134 days of age; and 9 g DL 135 to 156 days of age). Diets were formulated based on corn and soybean meal and supplemented with minerals, vitamins and amino acids to meet the nutritional requirements of the animals with except of DL, according to (Rostagno et al., 2011).
Animal slaughter and skeletal muscle sapling
Pigs were slaughtered at 156 days of age after 16 h of fasting. Pre-harvest handling and slaughtering procedures were in accordance with good animal welfare practices, following the Sanitary and Industrial Inspection Regulation for Animal Origin Products.
At slaughter, Logissimus (LM) muscle was collected in three pigs per treatment (genotype and dietary DL content). Samples were removed directly from the carcass right after animal bleeding and immediately immersed in tubes containing 15 ml of RNAHolder® (BioAgency, São Paulo, Brazil), kept at 4°C overnight and then stored at -20°C for subsequent RNA extraction.
After slaughter, each carcass was split into two identical longitudinal halves and chilled at 4°C for 24 h. At the end of carcass fabrication, a boneless Logissimus section 12 cm thick was collected. Logissimus samples were individually vacuum packaged and frozen at − 20 °C. Each frozen Logissimus sample was standardized into two 2.54 cm thick steak samples (AMSA, 1995). All steaks were then vacuum packaged and held at - 20 °C for further quality trait analysis.
Instrumental color analysis, drip loss and intramuscular fat content
Instrumental color analysis was performed at the beginning of carcass fabrication after 24 h post mortem chill. Color measurements were taken at Logissimus muscle at the 10th rib after 30 min blooming. A total of three readings of L*, a* and b* values were obtained for each carcass. Color coordinates (L*, a* and b*) were recorded with a digital Minolta CR300 chromometer (Minolta Co., Osaka, Japan). Coordinate a* ranged from red (+ a*) to green (− a*) and coordinate b* from yellow (+ b*) to blue (− b*) (Hunterlab, 1996).
Drip loss was determined according the bag method described by Honikel (1987). Briefly, meat samples were collected 24 h after postmortem at 14th rib and trimmed from visible fat and connective tissue. Then, meat samples were divided into two slices weighing approximately 120 grams. Each slice was then hung in a hook under a lid of an airtight container and kept at 4 °C for 24 h. Following the 48 h chill, meat samples were weighed and the weight difference was divided by the initial sample weight.
Powdered lyophilizated meat samples were analyzed for moisture by the Method 934.01 (AOAC, 1990), and ether extract (EE) by the Method Am 5-04 (AOCS, 2009) to determine the amount of intramuscular fat content.
RNA extraction, cDNA synthesis and gene expression analysis
Total RNA from each LM samples was isolated using ∼40 mg of tissue previously stored in RNAHolder®. Samples were homogenized in buffer RLT containing 1% β-mercaptoethanol (RNeasy Mini Kit; Qiagen, Valencia, CA, USA) and lysed with a tissue ruptor (Qiagen) homogenizer. The total RNA from the LM muscle samples was extracted with the RNeasy Mini Kit following the manufacturer’s recommendations. Additional treatment with DNase was performed on the columns using the RNase-free DNase Set (Qiagen), according to the manufacturer’s recommendations. The RNA concentration, purity and integrity were determined with an Agilent RNA 6000 Nano Kit using the Agilent 2100 Bioanalyzer (Agilent Technologies Inc., Ontario, Canada). Only samples with values greater 8.0 for RNA integrity (RIN) were used for cDNA synthesis.
The ProtoScript M-MuLV First Strand cDNA Synthesis Kit (New England, BioLabs Inc., Ipswich, Massachusetts, USA) was used to produce cDNA. The reactions were performed with 6 μg of total RNA and 2 μl of 50 μM oligo(dT)23VN primer, following the manufacturer’s recommended protocol. The cDNA concentrations from the samples were estimated on a NanoVue Plus spectrophotometer (GE Healthcare). Finally, the single-stranded cDNA samples were stored at -20°C for analysis.
The expression of 10 genes was assessed by qRT-PCR analysis. The genes evaluated in this study are either involved with lipid metabolism such as Fatty acid synthase (FAS), Stearoyl-CoA desaturase (SCD), Protein kinase AMP-activated γ1 subunit (PRKAG1), Protein kinase AMP-activated γ3 subunit (PRKAG3), Hormone sensitive lipase (HSL), Heart fatty acid-binding protein (H-FABP), and skeletal muscle fiber type such as Myosin heavy chain I (MyHC I), IIa (MyHC IIa), IIb (MyHC IIb) and IIx (MyHC IIx). The primers for the 10 genes were designed using PrimerQuest (www.idtdna.com/Scitools/Applications/PrimerQuest), provided by Integrated DNA Technologies Inc. (Coralville, IA, USA). β-actin gene was used as the reference gene for normalization, as it showed higher efficiency and less variation across treatments than GAPDH (data not shown). The list of primer sets and accession numbers are summarized in Table 1.
| Gene symbol | Primer sequence (5’-3’)a | Aces. number - NCBI |
|---|---|---|
| FAS | Fw: GTACCCGGACCCAGAATA | AJ001202.1 |
| Rev: GTGGTGCAAGGGTTACAG | ||
| HFABP | Fw: CACTGGATGGAGGCAAAC | JN646857.1 |
| Rev: GGGTGAGTGTCAGGATGA | ||
| SCD | Fw: CACTGGGAAGCACAAGAG | NM_213781.1 |
| Rev: CCCAAGACTCAGCCAAAG | ||
| PRKAG1 | Fw: GCATGAGACCCTGGAAAC | NM_001001642.2 |
| Rev: CCCTTGACCACGTCATTC | ||
| PRKAG3 | Fw: GCTGACCATCACAGACTTC | NM_214077.1 |
| Rev: TCCCTCCAGGTCTCAATC | ||
| HSL | Fw: GCTCACGGTCACCATTTC | AY559451.1 |
| Rev: CCTCACTGTCCTGTCCTT | ||
| MyHC I | Fw: AAGGGCTTGAACGAGGAGTAGA | AB053226 (WIMMERS et al., 2008) |
| Rev: TTATTCTGCTTCCTCCAAAGGG | ||
| MyHC IIa | Fw: AACACCCTGACCAAAGCTAAA | AB025256 |
| Rev: TCCTCTTGGCTCTCTCTAAGTC | ||
| MyHC IIb | Fw: ATGAAGAGGAACCACATTA | AB025261 (WIMMERS et al., 2008) |
| Rev: TTATTGCCTCAGTAGCTTG | ||
| MyHC IIx | Fw: AGAAGATCAACTGAGTGAACT | AB025262 (WIMMERS et al., 2008) |
| Rev: AGAGCTGAGAAACTAACGTG | ||
| β-actin1 | Fw: GGACTTCGAGCAGGAGATGG | NM_213978.1 |
| Rev: TCTGCTGTCTTTGGAACTTTGTCT |
Note: 1Reference gene; aFw= Forward; Rev= Reverse.
Table 1. Nucleotide sequence of the primers and accession number of the nucleotide sequences used in the qRT-PCR reactions identified as differentially expressed using the EST libraries analyzed
The qRT-PCR analyses were performed by using the GoTaq® qPCR Master Mix (Promega Corporation, Madison, WI, USA) following the manufacturer’s instructions in an ABI Prism 7300 Sequence Detection System thermocycler® (Applied Biosystems, Foster City, CA, USA). The reaction consisted of an initial step at 95°C for 10 min, a second step of 40 cycles with the same temperature for 15 s and a final extension step at 60°C for 60 s. After the amplification cycles, an additional gradient step from 60°C to 95°C was used to obtain a melting curve. From the qRT-PCR raw data, the Ct values were regressed on the log10 amount of cDNA. The resulting slope was used to calculate the amplification efficiency (E) through  Thus, the highest amplification efficiency was stated according to appropriate primer concentration and quantity of cDNA for each gene to be used in the final qRT-PCR reactions. All reactions were done in duplicate, and the coefficients of variation (CV) for Ct values from replicates within each sample were lower than 5%, indicating acceptable accuracy and reproducibility.
Statistical analysis
The analyses of variance for meat quality traits were performed separately by gender through the following model:

where: yijk is the observed phenotypic values for the considered meat quality trait; μ is the general mean; Gi is the genotype effect; Lj is the dietary DL content effect; GxNij is the interaction effect between Gi and Lj; Wij is the slaughter weight assumed as a linear covariate within genotype; eijk is the random residual term.These mentioned analyses were performed using the MIXED procedure of SAS 9.3 (Statistical Analysis System Institute, Inc., Cary, NC, USA). Mean contrasts were compared by Tukey`s test at significance level of 5%.
Statistical analysis of Ct data in each growing phase was performed by the SAS® macro % QPCR_MIXED (https://www.msu.edu/~steibelj/JP files/QPCR.html), which is suitable to analyze data from qRT-PCR by assuming independent random effects for reference and target genes in each biological replicate.
In summary, this statistical method is more accurate, powerful and flexible than existing alternatives for analysis of relative quantification qRT-PCR data (Steibel et al., 2009). The following model was used for this analysis:
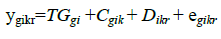
where: ygikr is the measured expression level of gth gene on kth animal submitted to the ith treatment (combination of genotype and dietary DL content) at the rth sample; TGgi is the effect of the ith treatment on the expression of gth gene;  is the gene-specific random effect of the kth animal submitted to the ith treatment;
  is a random sample-specific effect (common to both genes); and
  is the random residual term. The fold change values were estimated with the 2-ΔΔCt method. For each target gene, the comparisons across treatments inside each phase were performed by using adjusted Student’s t-test at level of 5% of significance.
Results
There was no interaction between genotypes and dietary DL content for any meat quality and expression of genes evaluated (P>0.05) in both barrows and gilts. Therefore, results of effects of genotypes and dietary DL content will be presented and discussed separately.
I. Barrows
Meat quality traits
There was no interaction between genotypes and dietary DL contents for any meat quality traits evaluated (P>0.05) in barrows. Different values of drip loss were observed for pork from different genotypes (P=0.02) where Piau crossbred group had the least value for this variable, compared to Pietrain crossbred. No differences were observed for values of L*, a*, b* and ether extract (P>0.05) among genotypes (Table 2). Dietary DL content did not affect any of the meat quality variables evaluated in this study (P>0.05).
| Item | Genotype | CV | P-value | Dietary DL content | CV | P-value | ||||
|---|---|---|---|---|---|---|---|---|---|---|
| G1 | G2 | G3 | (%) | Low | Medium | High | (%) | |||
| Drip loss (%) | 7.77b | 9.61ab | 11.14a | 29.29 | 0.02 | 10.42 | 9.30 | 8.80 | 30.05 | 0.22 |
| L* | 59.87 | 61.54 | 60.70 | 5.07 | 0.61 | 61.96 | 60.28 | 59.88 | 4.75 | 0.11 |
| a* | 6.37 | 6.69 | 6.98 | 19.67 | 0.38 | 6.53 | 6.67 | 6.84 | 19.99 | 0.79 |
| b* | 15.24 | 15.53 | 15.50 | 7.34 | 0.91 | 15.33 | 15.52 | 15.42 | 7.35 | 0.89 |
| Ether extract (%) | 2.20 | 2.46 | 2.32 | 19.84 | 0.54 | 2.44 | 2.19 | 2.35 | 20.23 | 0.30 |
Note : CV: Coefficient of variation.
G1=Piau crossbreds; G2=Duroc crossbreds; G3=Pietrain crossbreds.
Means with different letters differ at P≤0.05 by Tukey`s test.
Table 2. Effect of genotype and dietary digestible lysine (DL) content on drip loss, color and ether extract of barrows
Gene expression of lipid metabolism-related genes in Logissimus muscle
There was a higher expression of the FAS in skeletal muscle of Piau crossbred compared to Duroc and Pietrain crossbred pigs (Figure 1A). On the other hand, a higher expression of the H-FABP was observed in skeletal muscle of Duroc and Pietrain crossbred compared to Piau crossbred pigs (Figure 1A). Piau crossbred had higher expression of PRKAG1 compared to Duroc crossbred pigs (Figure 1A). The expression of SCD gene was higher in Duroc crossbred compared to Piau crossbred pigs (Figure 1A).

Figure 1: Fold change values for genes that exhibited differential expression between G1, G2 and G3 (G1=Piau crossbreds; G2=Duroc crossbreds; G3=Pietrain crossbreds) (A); and between Low, Medium and High dietary digestible lysine contents (B) in Logissimus muscle of barrows. Bars above the origin means higher expression at first level relatively to second. *P<0.05.
The dietary DL content did not affect the expression of the genes evaluated with exception of PRKAG3, which was greater in fed Low compared to those fed Medium and High digestible lysine content (Figure 1B).
Gene expression of myosin heavy chain genes in Logissimus muscle
There was a higher expression of the MyHC IIb in Logissimus muscle of Duroc and Pietrain crossbred compared to Piau crossbred (Figure 2A). The dietary DL content did affect the expression of the MyHC IIb gene in Logissimus muscle, which was greater in fed Medium and High compared to those fed Low digestible lysine content (Figure 2B).

Figure 2: Fold change values for MyHC IIb gene that exhibited differential expression between G1, G2 and G3 (G1=Piau crossbreds; G2=Duroc crossbreds; G3=Pietrain crossbreds) (A); and between Low, Medium and High dietary digestible lysine content (B) in Logissimus muscle of barrows. Bars above the origin means higher expression at first level relatively to second. *P<0.05.
II. Gilts
Meat quality traits
No interaction was observed (P>0.05) between genotypes and dietary DL contents for any meat quality traits evaluated in crossbred gilts. No changes were observed for any meat quality traits evaluated among genotypes (P>0.05), with exception of drip loss (P=0.01) which was greater in pork from Pietrain compared to Duroc and Piau crossbred pigs (Table 3).
| Item | Genotype | CV | P-value | Dietary DL content | CV | P-value | ||||
|---|---|---|---|---|---|---|---|---|---|---|
| G1 | G2 | G3 | (%) | Low | Medium | High | (%) | |||
| Drip loss (%) | 6.85b | 7.37b | 10.24a | 34.04 | 0.01 | 8.07 | 8.16 | 7.60 | 36.27 | 0.31 |
| L* | 59.76 | 59.91 | 59.46 | 4.59 | 0.75 | 60.33 | 59.65 | 59.16 | 4.66 | 0.25 |
| a* | 6.22 | 7.25 | 6.58 | 19.05 | 0.71 | 7.24 | 6.02 | 6.78 | 18.36 | 0.08 |
| b* | 14.97 | 15.62 | 14.93 | 7.01 | 0.74 | 15.28 | 15.14 | 15.10 | 6.97 | 0.29 |
| Ether extract (%) | 2.35 | 2.23 | 1.94 | 25.59 | 0.49 | 2.53ª | 2.01ªb | 1.97b | 22.81 | 0.01 |
(Note: CV: Coefficient of variation)
G1=Piau crossbreds; G2=Duroc crossbreds; G3=Pietrain crossbreds.
Means with different letters differ at P≤0.05 by Tukey`s test.
Table 3. Effect of genotype and dietary digestible lysine (DL) content on drip loss, color and ether extract of gilts
Meat color (L*, a* and b*) and ether extract were not affected (P>0.05) by the dietary DL contents. On the other hand, the intramuscular fat content (ether extract %) was greater in fed Low compared to those fed High digestible lysine content (P=0.01; Table 3).
Gene expression of lipid metabolism-related genes in Logissimus muscle
There was a higher expression of the FAS in skeletal muscle of Piau crossbred compared to Duroc and Pietrain crossbred pigs (Figure 3). Piau crossbred showed higher expression of PRKAG1 compared to Pietrian crossbred gilts (Figure 3). A higher expression of the SCD gene of Duroc and Pietrain crossbreds compared to Piau crossbred was observed (Figure 3). The dietary DL content did not affect (P>0.05) the expression of any of the lipid metabolism-related genes in skeletal muscle of gilts.

Figure 3: Fold change values for genes that exhibited differential expression between G1, G2 and G3 (G1=Piau crossbreds; G2=Duroc crossbreds; G3=Pietrain crossbreds) in Logissimus muscle of gilts. Bars above the origin means higher expression at first level relatively to second. *P<0.05
Gene expression of myosin heavy chain genes in Logissimus muscle
There was a higher expression of the MyHC IIa gene in Logissimus muscle of Duroc and Pietrain crossbred compared to Piau crossbred gilts (Figure 4A). The dietary DL content did affect the expression of the MyHC IIb and IIa genes in Logissimus muscle. Expression of the MyHC IIb gene was greater in fed High compared to those fed Medium digestible lysine content (Figure 4B). A higher expression of the MyHC IIa gene was observed in fed High compared to those fed Low and Medium digestible lysine content (Figure 4B).

Figure 4: Fold change values for MyHC IIa gene that exhibited differential expression between G1, G2 and G3 (G1=Piau crossbreds; G2=Duroc crossbreds; G3=Pietrain crossbreds) (A); and MyHC IIa and IIb between Low, Medium and High dietary digestible lysine contents (B) in Logissimus muscle of gilts. Bars above the origin means higher expression at first level relatively to second. *P<0.05.
Discussion
mRNA expression of MyHC isoforms in Logissimus muscle
When protein deposition rate decreases, lipid deposition becomes the major component of the weight gain and energy request to fat tissues increases (Hocquette et al., 2000). Consequently, less energy substrate to contraction will be available to muscle fibers and the energy metabolism of glycolytic fibers switch towards to oxidative energy metabolism, which is a more efficient pathway to produce energy (Hocquette et al., 1998). On the other hand, intensive selection for lean muscle growth in commercial pigs leaded to a shift in skeletal muscle metabolism toward to a more glycolytic and less oxidative fiber type (Chang et al., 2003) as a consequence of rapid deposition of lean tissue, which explains the greater mRNA expression of markers for glycolytic (MyHC IIb and MyHC IIa) in skeletal muscle of Duroc and Pietrain crossbred compared to Piau crossbred barrows.
The differences in mRNA expression of MyHC observed in the present study may also explains the differences observed for drip loss among genotypes for barrows and gilts, since the frequency of skeletal muscle fibers can be predicted by their predominant MyHC isoforms (I, IIa, IIx and IIb) (Kim et al., 2013; Lee et al., 2012; Ruusunen and Puolanne, 2004). These MyHC isoforms possess particular metabolic and contractile characteristics and are differently distributed among muscles, suggesting that MyHC distribution is related to their function (Lefaucheur et al., 2002). Type I muscle fibers have greater oxidative capacity to support sustained contraction, whereas type IIb fibers are predominantly glycolytic and rapidly use glycogen for short bursts of activity. The IIa and IIx fibers are intermediate to type I and IIb fibers (Chang et al., 2003). Thus, the greater the frequency of type IIb fibers, which may negatively afftects the water-holding capacity of meat and leads to a greater drip loss of pork (Klont et al., 1998). In the present study, the lower drip loss observed in pork from Piau crossbred pigs may have occurred due to the lower frequency of type IIb muscle fibers, since the mRNA expression of MyHC IIb was lower in Piau compared to the other genotypes.
With regard to the effects of dietary DL contents, we observed a higher mRNA expression of MyHC IIb in Logissimus muscle of cross-bred pigs fed Medium and High digestible lysine content compared to crossbred, either barrows and gilts, that received Low digestible lysine content. The higher mRNA expression of MyHC IIb in Logissimus muscle caused by dietary DL content suggests that lysine stimulates the synthesis of skeletal muscle proteins at a transcriptional level (Morales et al., 2015). Lysine is the most abundant amino acid in muscle proteins of the pig (Bikker et al., 1994). The greater mRNA expression of MyHC IIb in Logissimus muscle observed in gilts fed with different dietary digestible lysine contents support the hypothesis that lysine may stimulate, either direct or indirectly, the transcription of MyHC IIb (Morales et al., 2015).
Oxidative fibers are rich in mitochondria, which are related to the relative capacity of muscle tissue to oxidize fatty acids (Guo et al., 2011). A previous study reported that the content of carnitine in the Logissimus muscle was lower in pigs fed with low dietary lysine contents, promoting increase of IMF. Carnitine plays a pivotal role in β-oxidation of fatty acids by transporting fatty acyl-CoA across the inner mitochondrial membrane (Katsumata et al., 2012). Therefore, in the present study the reduced content of lysine decreased the expression of MyHC IIa in the Logissimus muscle of gilts, which may have led to a decrease of β-oxidation contributing to a higher intramuscular fat content.
Expression of lipid metabolism-related genes in Logissimus muscle
The intramuscular fat (IMF) measured by quantification of ether extract content on meat was greater for the gilts with the decreasing of lysine content in dietary. This result may indicates that IMF may change according to the variation of DL on dietary likely due to the increase of skeletal muscle growth rate when DL intake increases, leading to a proportional decrease of IMF content.
The IMF did not differ between genotypes, although several authors have found greater IMF content for local breeds compared to commercial pigs (Guo et al., 2011; Zhao et al., 2009). The lack of differences in IMF content among genotypes was not expected as commercial pigs usually present lower IMF content due to their selection for lean growth. However, it has been shown that IMF deposition between Piau and commercial pigs does not present great difference when animals are slaughtered at 120 days (2.48% for Piau compared to 2.04% for commercial pigs under the same dietary treatment) (Serão et al., 2010). Moreover, it must be emphasized that in the current trial we have used diets containing increase levels of dietary lysine, which is known to improve lean deposition, which impairs the deposition of intramuscular fat due to increase of energy requirements, which may have contributed to the unexpected lack of differences in IMF among breeds. Based on the results of intramuscular fat content, we have evaluated the mRNA expression of genes that encode key enzymes related to lipid metabolism to understand the possible molecular factor underlying IMF deposition. Regarding lipogenesis, we have found differences in mRNA expression levels of FAS, H-FABP, SCD and PRKAG1 between Piau, Duroc and Pietrain crossbred pigs. FAS enzyme catalyzes all the reaction steps in the synthesis of palmitic acid from acetyl-CoA and malonyl-CoA in the presence of NADPH (Muñoz et al., 2003; Sul and Wang, 1998), i.e., FAS is a key determinant of the maximal capacity of a tissue to synthesize fatty acids by de novo pathways (Smith et al., 2003). Our results showed that mRNA expression of FAS was greater in skeletal muscle of Piau crossbred pigs than in Duroc and Pietrain crossbred pigs.
We observed a higher mRNA expression of H-FABP and SCD in skeletal muscle of Duroc and Pietrain crossbred compared with Piau crossbred pigs. H-FABP is located on pig chromosome six and is expressed in various tissues, predominantly in cardiac and skeletal muscle cells (Zhao et al., 2010). The protein encoded by H-FABP is a major member of the fatty acid binding protein (FABP) family, which plays a critical role in the intracellular trafficking of long-chain fatty acids and metabolic homeostasis (Chmurzyńska, 2006). Our data indicate that a greater transport of fatty acid into intracellular trafficking compared may occur in skeletal muscle of Duroc and Pietrain crossbred to Piau crossbred pigs, facilitating the transport of fatty acids from the membrane to the sites of fatty acid oxidation.
The greater mRNA expression of SCD in skeletal muscle of Duroc and Pietrain crossbreds compared to Piau also suggests differences in lipid oxidation in skeletal muscle of these breeds. A decrease of SCD may lead to an increase of AMP-activated protein kinase (AMPK), which is a major regulator of energy metabolism. When phosphorylated, AMPK impairs lipid biosynthesis and increases fatty acid oxidation. Thus, although only mRNA expression was evaluated in the present study, the increased SCD expression may indicate an increase in fatty acid oxidation in skeletal muscle of Pietrain and Duroc compared to Piau cross-bred pigs.
Intriguing, our present results showed that the relative mRNA expression levels of PRKAG1 were greater in Piau crossbred pigs than in Duroc and Pietrain crossbred pigs. The PRKAG1 gene encodes a protein involved in fatty acid metabolism and is one of three isoforms of the AMPK γ subunit (Bernard et al., 2007). At the cellular level, AMPK is a regulatory mechanism that switches off ATP-consuming processes (lipogenesis, neoglucogenesis) and switches on catabolic processes that produce ATP (fatty acid oxidation, glycogenolysis, glycolysis) (Hardie, 2011). Indeed, by inhibiting acetyl-CoA carboxylase (ACC) enzyme (Hardie, 2003), AMPK activates fatty acid oxidation and reduces fatty acid synthesis (Hardie, 2003). However, our results also showed that the relative mRNA expression of FAS in Logissimus muscle was higher in Piau crossbred than in the Duroc and Pietrain crossbred pigs. Collectively, these results suggest that the intramuscular fatty acid turnover, although in different ways, did not differ between genotypes, which may have been the cause of the lack of differences in the amount of IMF.
Differences in mRNA expression of PRKAG3 were observed between Low, Medium and High dietary DL contents in barrows. PRKAG3 (AMPK γ3 subunit) gene is considered to be essential in energy homoeostasis due to its ability to ‘sense’ the levels of ATP, ADP and AMP (Hardie, 2011). One of its target proteins is glycogen synthase, the key regulatory enzyme in the glycogen biosynthetic pathway, which is inhibited by the phosphorylating activity of AMPK (Carling and Hardie, 1989). Due to its effects on glycogen synthase, AMPK exerts a strong influence on glycogen content in muscle tissue (Galve et al., 2013). AMPK γ3 subunit also has been associated with enhanced oxidative metabolism, indicated higher relative area of IIA fibers (oxidative) and lower relative area of IIB fibers (glycolytic) (Lebret et al., 1999). The oxidative fibers may be associated to increased IMF content (Guo et al., 2011). Furthermore, low dietary lysine content decreases the transcription of fibers IIB, but there is no available report showing the mechanism by which lysine causes this effect (Morales et al., 2015) and increased IMF content (Katsumata et al., 2012; Madeira et al., 2013).
Conclusion
In our study it was observed a higher mRNA expression of PRKAG3 in skeletal muscle of barrows fed Low dietary DL content compared to those fed Medium and High dietary DL contents, although we did not observe differences in IMF content. On the other hand, a greater IMF content was observed in skeletal muscle of gilts fed Low dietary DL content, which was not associated with changes in mRNA expression of PRKAG3 but with a decrease in mRNA expression MyHC IIa and an increase in mRNA expression of MyHC IIb. Thus, our data indicate that the dietary DL contents may affect the lipid metabolism in skeletal muscle of barrows and gilts in a different manner. Thus, our results indicate that genotype and dietary lysine appear to affect the expression of lipid metabolism and myosin heavy chain genes of barrows and gilts in different ways.
Acknowledgments
Funding from CNPq (Grant no. 455107/2014-9), FAPEMIG (Grant no. APQ 00905-14) CAPES (PROEX/ UFV/PPGZ).
About the Authors
Corresponding Author
PS Lopes
Departamento de Zootecnia, Universidade Federal de Viçosa, Viçosa, Minas Gerais, Brazil
- Email:
- plopes@ufv.br
References
- AMSA (1995) Research guidelines for cookery, sensory evaluation and tenderness measurements of fresh meat. (2nd edn). National Livestock and Meat Board, Chicago.
- AOAC (1990) Official methods of analysis. Association of Official Analytical Chemists, Washington D.C, USA. https://doi.org/10.1002/jps.2600650148
- AOCS (2009) Official methods and recommended practices of the Aocs, American oil chemists' society, Denver, USA.
- Bernard C, Cassar-Malek I, Cunff ML, Dubroucq H, et al. (2007) New indicators of beef sensory quality revealed by expression of specific genes. J Agric Food Chem 55 (13): 5229-5237. https://doi.org/10.1021/jf063372l
- Bikker P, Verstegen MWA, Bosch MW (1994) Amino acid composition of growing pigs is affected by protein and energy intake. J Nutr. 124 (10): 1961-1969. https://doi.org/10.1093/jn/124.10.1961.
- Carling D, Hardie DG (1989) The substrate and sequence specificity of the AMP-activated protein kinase. Phosphorylation of glycogen synthase and phosphorylase kinase. Biochim. Biophys. Acta Mol Cell Res. 1012: 81-86. https://doi.org/10.1016/0167-4889(89)90014-1
- Chang KC, da Costa N, Blackley R, Southwood O, et al. (2003) Relationships of myosin heavy chain fibre types to meat quality traits in traditional and modern pigs. Meat Sci. 64(1): 93-103. https://doi.org/10.1016/s0309-1740(02)00208-5
- Chmurzyńska A (2006) The multigene family of fatty acid-binding proteins (FABPs): Function, structure and polymorphism. J Appl Genet 47 (1): 39-48. https://doi.org/10.1007/bf03194597
- Doran O, Moule SK, Teye GA, Whittington FM, et al. (2006) A reduced protein diet induces stearoyl-CoA desaturase protein expression in pig muscle but not in subcutaneous adipose tissue: relationship with intramuscular lipid formation. Br. J. Nutr. 95 (3): 609-617. https://doi.org/10.1079/bjn20051526
- Galve A, Burgos C, Varona L, Carrodeguas JA, et al. (2013) Allelic frequencies of PRKAG3 in several pig breeds and its technological consequences on a Duroc × Landrace‐Large White cross. J Anim Breed Genet. 130: 382-393. https://doi.org/10.1111/jbg.12042
- Guo J, Shan T, Wu T, Zhu LN, et al. (2011) Comparisons of different muscle metabolic enzymes and muscle fiber types in Jinhua and Landrace pigs. J Anim Sci 89 (1): 185-91. https://doi.org/10.2527/jas.2010-2983
- Hardie DG (2003) Minireview: the AMP-activated protein kinase cascade: the key sensor of cellular energy status. Endocr. 144: 5179-5183.
- Hardie DG (2011) Signal transduction: how cells sense energy. Nature 472: 176-177. https://doi.org/10.1210/en.2003-0982
- Hocquette JF, Ortigues-Marty I, Damon M, Herpin P, et al. (2000) Energy metabolism in skeletal muscle of meat-producing animals. INRA Prod. Anim. 13: 185-200.
- Hocquette J, Ortigues-Marty I, Pethick D, Herpin P, et al. (1998) Nutritional and hormonal regulation of energy metabolism in skeletal muscles of meat-producing animals. Livest. Sci. 56 (2): 115-143. https://doi.org/10.1016/s0301-6226(98)00187-0
- Honikel KO (1987) The water binding of meat. Fleischwirtschaft. 67: 1098-1102.
- Hunterlab (1996) Applications note: CIE L* a* b* color scale. Hunterlab, Virginia, USA.
- Jurie C, Cassar-Malek I, Bonnet M, Leroux C, et al. (2007) Adipocyte fatty acid-binding protein and mitochondrial enzyme activities in muscles as relevant indicators of marbling in cattle. J. Anim. Sci. 85 (10): 2660-2669. https://doi.org/10.2527/jas.2006-837
- Katsumata M, Sch-Ichi K, Mitsuhito M, Eisaku T, et al. (2005) Reduced intake of dietary lysine promotes accumulation of intramuscular fat in the Logissimus dorsi muscles of finishing gilts. Anim. Sci. J. 76 (3): 237-244. https://doi.org/10.1111/j.1740-0929.2005.00261.x
- Katsumata M (2011) Promotion of intramuscular fat accumulation in porcine muscle by nutritional regulation. Anim. Sci. J. 82 (1): 17-25. https://doi.org/10.1111/j.1740-0929.2010.00844.x
- Katsumata M, Kyoya T, Ishida A, Ohtsuka M, et al. (2012) Dose-dependent response of intramuscular fat accumulation in Logissimus dorsi muscle of finishing pigs to dietary lysine levels. Livest. Sci. 149 (2): 41-45. https://doi.org/10.1016/j.livsci.2012.06.025
- Kim GD, Jeong JY, Jung EY, Yang HS, et al. (2013) The influence of fiber size distribution of type IIB on carcass traits and meat quality in pigs. Meat Sci. 94 (2): 267-273. https://doi.org/10.1016/j.meatsci.2013.02.001
- Klont RE, Broks L, Eikelenboom G (1998) Muscle fibre type and meat quality. Meat Sci. 49: S219-S229. https://doi.org/10.1016/s0309-1740(98)00086-2
- Lebret B, Le Roy P, Monin G, Lefaucheur L, et al. (1999) Influence of the three RN genotypes on chemical composition, enzyme activities, and myofiber characteristics of porcine skeletal muscle. J. Anim. Sci. 77: 1482-1489. https://doi.org/10.2527/1999.7761482x
- Lee SH, Choe JH, Choi YM, Jung KC, et al. (2012) The influence of pork quality traits and muscle fiber characteristics on the eating quality of pork from various breeds. Meat Sci. 90: 284-291. https://doi.org/10.1016/j.meatsci.2011.07.012
- Lefaucheur L, Patrick E, Lydia P, Naïg G (2002) New insights into muscle fiber types in the pig. J. Histochem. Cytochem. 50 (5): 719-730. https://doi.org/10.1177/002215540205000513
- Madeira MS, Costa P, Alfaia CM, Lopes PA, et al. (2013) The increased intramuscular fat promoted by dietary lysine restriction in lean but not in fatty pig genotypes improves pork sensory attributes. J. Anim. Sci. 91 (7): 3177-3187. https://doi.org/10.2527/jas.2012-5424
- Morales A, García H, Arce N, Cota M, et al. (2015) Effect of L-lysine on expression of selected genes, serum concentration of amino acids, muscle growth and performance of growing pigs. J. Anim. Physiol. Anim. Nutr. 99 (4): 701-9. https://doi.org/10.1111/jpn.12267
- Moro C, Bajpeyi S, Smith SR (2008) Determinants of intramyocellular triglyceride turnover: implications for insulin sensitivity. Am. J. Physiol. Endocrinol. Metab. 294 (2): E203-E213. https://doi.org/10.1152/ajpendo.00624.2007
- Muñoz G, Ovilo C, Noguera JL, Sánchez A, et al. (2003) Assignment of the fatty acid synthase (FASN) gene to pig chromosome 12 by physical and linkage mapping. Anim. Genet. 34 (3): 234-235. https://doi.org/10.1046/j.1365-2052.2003.00987.x
- Rostagno HS, Albino LFT, Donzele JL, Gomes PC, et al. (2011) Brazilian tables for poultry and swine: composition of feedstuffs and nutritional requirements. (3rd edn). Universidade Federal de Viçosa, Viçosa.
- Ruusunen M, Puolanne E (2004) Histochemical properties of fibre types in muscles of wild and domestic pigs and the effect of growth rate on muscle fibre properties. Meat Sci. 67: 533-539. https://doi.org/10.1016/j.meatsci.2003.12.008
- Ruusunen M, Puolanne E, Sevon-Aimonen ML, Partanen K, et al. (2012) Carcass and meat quality traits of four different pig crosses. Meat Sci. 90 (3): 543-547. https://doi.org/10.1016/j.meatsci.2011.09.010
- Serão NV, Veroneze R, Ribeiro AM, Verardo LL, et al. (2011) Candidate gene expression and intramuscular fat content in pigs. J. Anim. Breed. Genet. 128 (1): 28-34. https://doi.org/10.1111/j.1439-0388.2010.00887.x
- Shen L, Lei H, Zhang S, Li X, et al. (2014) The comparison of energy metabolism and meat quality among three pig breeds. Anim. Sci. J. 85 (7): 770-779. https://doi.org/10.1111/asj.12207
- Smith S, Witkowski A, Joshi AK (2003) Structural and functional organization of the animal fatty acid synthase. Prog Lipid Res. 42 (4): 289-317. https://doi.org/10.1016/s0163-7827(02)00067-x
- Steibel JP, Poletto R, Coussens PM, Rosa GJ (2009) A powerful and flexible linear mixed model framework for the analysis of relative quantification RT-PCR data. Genomics. 94 (2): 146-152. https://doi.org/10.1016/j.ygeno.2009.04.008
- Sul HS, Wang D (1998) Nutritional and hormonal regulation of enzymes in fat synthesis: Studies of fatty acid synthase and mitochondrial glycerol-3-phosphate acyltransferase gene transcription. Annu. Rev. Nutr. 18 (1): 331-351. https://doi.org/10.1146/annurev.nutr.18.1.331
- Zhao SM, Ren LJ, Chen L, Zhang X, et al. (2009) Differential expression of lipid metabolism related genes in porcine muscle tissue leading to different intramuscular fat deposition. Lipids. 44 (11): 1029-1037. https://doi.org/10.1007/s11745-009-3356-9
- Zhao SM, Ren LJ, Guo ML, Cheng X, et al. (2010) Muscle lipid metabolism gene expression in pigs with different H-FABP genotypes. Livest. Sci. 128 (3): 101-107. https://doi.org/10.1016/j.livsci.2009.11.005
Keywords:
Download:
Full PDF- Share This