Estimative of genetic diversity in germ-plasm of elephant grass using the Gower algorithm
Received: March 29, 2018
Accepted: September 01, 2018
Published: November 05, 2018
Genet.Mol.Res. 17(4): http://dx.doi.org/gmr16039934
DOI: http://dx.doi.org/10.4238/gmr16039934
Abstract
This work aimed at estimating the genetic divergence among 85 accessions of elephant-grass using the Gower algorithm for the joint study of quantitative and qualitative traits. The experiment was conducted in the city of Campos dos Goytacazes, Rio de Janeiro state, Brazil, with of 85 elephant-grass genotypes. It was applied a randomized block experimental design with two replications. The experimental unit consisted of one 5.5 m-line with spacing of 2 m, totaling 11 m2. The plot area was a sampling at the center of the plot. Morpho-agronomic, multi-categorical, and phenological traits were assessed. The estimation of the genetic distance matrix was carried out by means of the joint analysis of the quantitative and qualitative variables obtained based on the Gower algorithm. The data were analyzed using GENES and R program. The results revealed that there is a wide genetic variability among the accessions studied. Some accessions show low genetic distances, which indicates that they are duplicates in the germplasm bank.
Introduction
Elephant-grass (Pennisetum purpureum Schum.), which is originated from the African continent, occupies an extensive area under tropical conditions with yearly precipitation above 1000 mm along fertile valleys (Pereira et al., 2010). The specie is important perennial forage highly efficient for the atmospheric CO2 fixation. It produces more than 60 t. ha-1 year-1 of dry matter (Morais et al., 2009), besides having a rapid vegetative growth (Vidal et al., 2017). It can be cultivated to be managed under pasture, consortium and grazing conditions (Lira et al., 2010). The elephant-grass is an allogamous species with a wide genetic variability, distributed in the germ-plasm, for most of the morpho-agronomic traits (Cavalcante and Lira, 2010). The variability management in germ-plasm banks depends on the accurate available information about the degree of genetic divergence among the accessions. This is essential for the plant breeding and provides the breeder to estimate the genetic similarity among the cultivars to select parental combinations, as well as to keep the genetic diversity in breeding programs (Chotiyarnwong et al., 2007).
The use of multi-categorical traits for estimating the genetic diversity in plants is an economic practice and demands less time when compared to quantitative and molecular traits (Marim et al., 2009). Therefore, the joint analysis of the variables becomes an interesting alternative for a better quantification of the genetic variability of genotypes. Gower (1971) proposed a technique that allows the simultaneous analysis of quantitative and qualitative data. That method permits distance matrix values to be between 0 and 1. For that, it is needed the standardization of the quantitative and qualitative variables (Ledo et al., 2008).
The joint analysis of qualitative and quantitative data by means of the Gower algorithm enables a better understanding of the studied characteristics, allowing more critical and efficient conclusions, from a statistical point of view, about the genetic relationship among the accessions under study (Torres et al., 2015). Given that, this work proposed to estimate the genetic divergence among 85 accessions of elephant-grass applying the Gower algorithm for the joint study of quantitative and qualitative data.
Material and Methods
The experiment was performed at the Agroenergy and Waste Management State Research Center of PESAGRO in Campos dos Goytacazes city, Rio de Janeiro state, Brazil, lying between 21º 19’ 23’’ south latitude and 41º 19’ 40’’ west longitude, and altitude varying between 20 and 30 m. The soil is classified as Yellow Latosol, which has the following characteristics: pH 5.5; phosphorus (mg dm-3) 18; potassium (mg dm-3) 83; Ca (cmolc dm-3) 4.6; Mg (cmolc dm-3) 3.0; Al (cmolc dm-3) 0.1; H + Al (cmolc dm-3) 4.5 and; C (%) 1.6. The experiment was composed of 85 elephant-grass genotypes (treatments) given by the Active Bank of Germ-plasm of Elephant-Grass/BAG-CE/CCTA-UENF of Embrapa Gado de Leite, located at Coronel Pacheco- MG (Table 1). The planting was performed in February 2011 by means of whole stems distributed in furrows at 10 cm depth. In the planting, 60 g of simple superphosphate were included; 50 days after the planting, the cover fertilizer was carried out applying 70 g of urea and 40 g of KCl (potassium chloride) per line, corresponding to 28.6 kg of N (nitrogen) and 24 Kg of K2O (potassium oxide) per hectare. It was applied the randomized block experimental design with two replications. The experimental unit was composed of one 5.5 m-line with spacing of 2 m, totaling 11 m2. The plot area was a sampling at the center of the plot.
| No. | Genotype | No. | Genotype |
|---|---|---|---|
| 1 | Elefante da Colômbia | 44 | Capim Cana D'África |
| 2 | Mercker | 45 | Gramafante |
| 3 | Três Rios | 46 | Roxo |
| 4 | Napier Volta Grande | 47 | Guaco/I,Z,2 |
| 5 | Mercker Santa Rita | 48 | Cuba-115 |
| 6 | Pusa Napier N 2 | 49 | Cuba-116 |
| 7 | Gigante de Pinda | 50 | Cuba-169 |
| 8 | Napier N 2 | 51 | King Grass |
| 9 | Mercker S, E, A | 52 | Roxo Botucatu |
| 10 | Taiwan A-148 | 53 | Mineirão IPEACO |
| 11 | Porto Rico 534-B | 54 | Vruckwona Africano |
| 12 | Taiwan A-25 | 55 | Cameroon |
| 13 | Albano | 56 | CPAC |
| 14 | Hib, Gigante Colômbia | 57 | Guacu |
| 15 | Pusa Gigante Napier | 58 | Napierzinho |
| 16 | Elefante Híbrido 534-A | 59 | IJ 7125 cv empasc 308 |
| 17 | Costa Rica | 60 | IJ 7126 cv empasc 310 |
| 18 | Cubano Pinda | 61 | IJ 7127 cv empasc 309 |
| 19 | Mercker Pinda | 62 | IJ 7136 cv empasc 307 |
| 20 | Mercker Pinda México | 63 | IJ 7139 |
| 21 | Mercker 86 México | 64 | IJ 7141 cv empasc 306 |
| 22 | Taiwan A-144 | 65 | Goiano |
| 23 | Napier S,E,A, | 66 | CAC-262 |
| 24 | Taiwan A-143 | 67 | Ibitinema |
| 25 | Pusa Napier N 1 | 68 | 903-77 ou Australiano |
| 26 | Elefante de Pinda | 69 | 13 AD |
| 27 | Mineiro | 70 | 10 AD IRI |
| 28 | Mole de Volta Grande | 71 | 07 AD IRI |
| 29 | Porto Rico | 72 | Pasto Panamá |
| 30 | Napier | 73 | BAG - 92 |
| 31 | Mercker Comum | 74 | 09 AD IRI |
| 32 | Teresopólis | 75 | 11 AD IRI |
| 33 | Taiwan A-46 | 76 | 05 AD IRI |
| 34 | Duro de Volta Grande | 77 | 06 AD IRI |
| 35 | Mercker Comum Pinda | 78 | 01 AD iIRI |
| 36 | Turrialba | 79 | 04 AD IRI |
| 37 | Taiwan A-146 | 80 | 13 AD IRI |
| 38 | Cameroon - Piracicaba | 81 | 03 AD IRI |
| 39 | Taiwan A-121 | 82 | 02 AD IRI |
| 40 | Vrukwona | 83 | 08 AD IRI |
| 41 | P241 Piracicaba | 84 | União |
| 42 | IAC-Campinas | 85 | Pesagro Bord |
| 43 | Elefante Cachoeira Itapemirim |
Table 1: Genotypes from the Active Bank of Germplasm of Elephant-Grass (BAGCE) CCTA/UENF, 2012/2013 that were studied
After the establishment phase, in December 2011, all the genotypes were cut close to the soil surface (standardization cut). The first cut for assessment was carried out in November 2012, and the second one, in November 2013, that is, one cut per year over a period of two years. Morpho-agronomic traits, which were measured after each year of growth, were assessed throughout the experiment. The following variables were evaluated in all the accessions:
• Number of tillers per linear meter (NT): counting of the number of tillers was carried out in 1 m linear of a plot line.
• Plant height in meters (HT): Plant height measurements were measured with graduated scale, taking one measurement of each plot, starting from the insertion of the stem into the soil up to the curvature of the last leaf without counting the flag leaf.
• Stem diameter (SD) in cm: The measurements of the stem diameter were performed about 10 cm from the soil taking an average of three measurements using a digital caliper.
• Width and length of the leaf blade in cm (BW and BL, respectively): It was performed with a graduated scale in three samples of each genotype; it was measured in the third whole leaf from the apical meristem of the stem to the basal meristem of the root, both in width and length measurements; the first one was taken from the highest width of the blade; subsequently, it was taken the average of the width and the length separately.
From the multi-categorical traits, only the clump shape (CS) was evaluated in the plots with 12 months of growth; all the others (general color of the plot plants; hair intensity on the leaf sheaths; and angulation of leaves) were measured in plots of six months of growth in order to the advanced growth age not to interfere with the result.
• Clump shape (CS): the clump shape can have the following values:
1. Open;
2. Semi-open;
3. Erect.
• General color of the plot plants (CP): The general color of the plot plants can have the following values:
1. Light green;
2. Dark green;
3. Purple.
• Hair intensity on leaf sheaths (HIL):
1. Glabra;
2. Little hair;
3. Much hair.3. Much hair.
• Leaf angulation (LA): the leaves can have the following angles:
1- Erect leaves: the plant that produces young leaves, which form an angle from 0° to 30° with the stem, will be considered as an erect leaf;
2- Semi-erect leaves: the plant that produces young leaves, which form an angle from 30° to 60° with the stem, will be considered as a semi-erect leaf;
3- Prostrate leaves: the plant that produces young leaves, which form an angle from 60° to 90° with the stem, will be considered as a prostate leaf.
The multi-categorical traits were assessed according to Daher et al. (1997). The phenological traits assessed were number of days for the emergence of 10% of flag leaf and percentage of flowering at the end of the reproductive period. For that, it was necessary to quantify, once a week, the percentage of flowering and the percentage of flag leaf in each accession. Subsequently, it was evaluated how many days of growth each accession released 10% of flag leaf, and what was the total of flowering of each genotype at the end of flowering. From those data, the analysis of variance and the Scott-Knott cluster at 5% (Scott and Knott, 1974) were done. Thus, the accessions were classified as follows:
• Number of days for the emergence of 10% of flag leaf:
(Cut 1- 2012)
1- Super early: from 104 to 130 days.
2- Early: from 131 to 146 days.
3- Medium: from 147 to 177 days.
4- Late: from 178 to 209 days.
(Cut 2- 2013)
1- Super early: from 122 to 134 days.
2- Early: from 134 to 153 days.
3- Medium: from 154 to 167 days.
4- Late: from 168 to 183 days.
• Percentage of flowering at the end of the reproductive period:
(Cut 1- 2012)
1- Fully flowered: 100% of flowering.
2- Partially flowered: 60% to 45% of flowering.
3- Little flowered: 9.5 to 44% of flowering.
(Cut 2- 2013)
1- Fully flowered: 76% to 100% of flowering.
2- Partially flowered: 75 to 41% of flowering.
3- Little flowered: inferior to 40% of flowering.
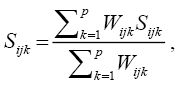
The estimate of the genetic distance matrix was performed by means of the joint analysis of the quantitative and qualitative variables obtained based on the Gower algorithm (1971), expressed by:
 in which:
K = number of variables (k = 1, 2,…, p); i and j = two individuals representing the accession; Wijk = weight given to the comparison ijk, assigning value 1 for valid comparisons and value 0 for invalid comparisons (when the variable value is missing in one or both individuals); Sijk = variable contribution k in the similarity between the individuals i and j, with values between 0 and 1.
For a qualitative variable (nominal), if the value of the variable k is the same for both individuals, I and j, then Sijk = 1, if not, it is equal to 0; for a quantitative variable (continuous) Sijk = 1 - | xik – xjk | / Rk, in which xik and xjk are the values of the variable k for the individuals i and j, respectively, and Rk is the interval (maximum value minus minimum value) of the variable k in the sample. The division by Rk ends with the differences between variables scales and produces a value within the interval [0, 1] and equal weights.
The genotypes were divided into clusters according to the multivariate agglomerative method of Tocher. This analysis selected the criteria that state the mean distance of an intra-cluster is less than any inter-cluster distance. The maximum mean value of an intra-cluster distance was established as the maximum value of the Gower distance and obtained in the set of shorter distances for each genotype. The data were analyzed using GENES (Cruz, 2013) and R program (R development core team, 2006).
Results and Discussion
The cluster generated in the joint analysis of the qualitative and quantitative data, together with the Gower algorithm of the elephant-grass accessions in Campos dos Goytacazes municipality, Rio de Janeiro state, Brazil, showed the existence of genetic variability. A cut made at the distance of 0.215, considering the abrupt change point, formed 11 clusters; the pairs of accessions with greater similarity among the evaluated 85 accessions were allocated in those clusters (Figure 1).

Figure 1: Illustrative dendrogram based on the “UPGMA” (Unweighted Pair Group Method with Arithmetic Mean) methodology of the 85 genotypes of elephant-grass (Penissetum Purpureum Shum.) from the Active Bank of Germ-plasm of Elephant-Grass/BAG-CE/CCTA-UENF, obtained by the joint analysis of the quantitative and qualitative variables based on the Gower algorithm.
In a dendrogram, a major level change evidences the union of heterogeneous genotypes (Torres et al., 2015), however, even though there was the formation of 11 clusters, of the 85 accessions assessed, 52 were clustered in the cluster 1 (Table 2), which represents 61.18% of the accessions evaluated. The data allow deducing that such material is genetically similar to the morpho-agronomic traits assessed. This result determines that the number of clusters created is not always synonymous with a great genetic variability, since there can be a great accumulation of genotypes in only one cluster (Campos et al., 2010; Silva et al., 2013).
| Cluster | Accessions |
|---|---|
| 1 | 74, 83, 75, 76, 59, 23, 54, 53, 70, 33, 22, 66, 58, 27, 78, 71, 10, 34, 79, 67, 68, 26, 77, 43, 5, 6, 9, 36, 12, 45, 19, 8, 11, 1, 14, 62, 7, 35, 30, 64, 60, 4, 37, 3, 24, 39, 16, 15, 65, 17, 81, 2 |
| 2 | 44, 55, 42, 63, 38, 48, 82, 49, 51, 46, 47 |
| 3 | 84, 85, 50, 57, 56 |
| 4 | 20, 21, 13, 52, 25, 72 |
| 5 | 31, 32, 73 |
| 6 | 28, 29 |
| 7 | 61, 80 |
| 8 | 69 |
| 9 | 41 |
| 10 | 18 |
| 11 | 40 |
Table 2: Cluster analysis of 85 accessions of elephant-grass by the Tocher optimization method obtained based on the Gower algorithm.
Pereira et al. (2008) point to the existence of duplicates in the Bank of Germ-plasm of Embrapa Gado de Leite, once the accessions were from various collections and some material may have had its original name modified, and the accessions evaluated were provided by the Active Bank of Germ-plasm of Elephant-Grass/BAG-CE/CCTA-UENF, of Embrapa Gado de Leite. Similar results were found by Shimoya et al. (2002), who noticed the formation of 18 clusters when evaluating 99 genotypes of elephant-grass; the larger cluster covered 44.45% of the 99 genotypes.
The other clusters represented 38.82% of the accessions: cluster 2, composed of 11 accessions (12.94%); cluster 3, of 5 accessions (5.88%); cluster 4, by 6 accessions (7.05%); cluster 5, of 3 accessions (3.52%); cluster 6, of 2 accessions (2.35%); and clusters 8, 9, 10 and 11 were composed of only 1 accession each, which are the accessions 69 (13 AD), 41 (P241 Piracicaba, 18 (Cubano Pinda), and 40 (Vrukwona), which indicates to be the more divergent accessions (Allard, 1971). It was performed an optimization cluster of Tocher using only the 52 accessions of cluster 1 for their better separation (Table 3). This way, it was possible to see the formation of 23 subclusters, in which 11 accessions of the 52 reclustered remained in cluster 1, representing a total of 21.15% of the accessions reclustered. That corresponds to only 12.9% of the 85 assessed, proving that the reclustered of the accessions was efficient and provided a better separation of the accessions evaluated.
| Cluster | Accessions |
|---|---|
| 1 | 74, 83, 75, 76, 59, 23, 54, 53, 70, 33, 22 |
| 2 | 6, 8, 9, 5, 71 |
| 3 | 36, 37, 3, 65, 81 |
| 4 | 26, 35, 7 |
| 5 | 10, 24, 19 |
| 6 | 67, 68 |
| 7 | 27, 58 |
| 8 | 39, 45 |
| 9 | 16, 64 |
| 10 | 11, 12 |
| 11 | 43, 78 |
| 12 | 1, 34 |
| 13 | 66, 77 |
| 14 | 79 |
| 15 | 14 |
| 16 | 60 |
| 17 | 4 |
| 18 | 30 |
| 19 | 62 |
| 20 | 2 |
| 21 | 15 |
| 22 | 31 |
| 23 | 17 |
Table 3: Cluster analysis of 52 accessions of elephant-grass by the optimization method of Tocher obtained based of the Gower algorithm.m
The genetic distances ranged from 0.08 to 0.56, and the distance mean distance of the 85 accessions assessed was of 0.25. It reveals that there is a wide genetic variability among the accessions under study. The values here found were superior to the ones of Pereira et al. (2008), who obtained genetic distances ranging from 0.0 to 0.34 when evaluating the genetic diversity in 30 accessions of elephant-grass; and the distance mean of the 30 accessions was of 0.21.
The lowest dissimilarity coefficients were noticed in the combinations that involve the accessions (6 × 8); (22 × 23); (44 × 55); (53 × 59); (54 × 76); (58 × 70); (74 × 83); and (75 × 76). Among those combinations, the lowest distance is noticed between the accessions 74 and 83, respectively, accessions 09 AD IRI and 08 AD IRI. It is interesting to note that the accessions with the lowest dissimilarity coefficient had the same source. Those accessions are considered highly similar, due to having genetic distances lower than 0.1, which demonstrates that those accessions can have the same genetic background. As stated by Struwig et al. (2009), duplicate problems can occur in germ-plasm banks, because of wrong accession name and their loss of identity. Information about accession duplicity is of great relevance to rationalize the germ-plasm collection, that is, some accessions can be discarded without affecting the genetic diversity of the bank (Azevedo et al., 2012).
Regarding the higher dissimilarity coefficients, it was noted that the combinations involving the accessions (31 × 84); (32 × 50); (40 × 69); (50 × 69); (61 × 50); (73 × 40); (80 × 85); and (69 × 85) obtained the greatest distances, becoming promising combinations for the realization of future crosses with higher probability of obtaining genetic gains due to heterosis.
As stated by Gonçalves et al. (2008), the joint analysis of qualitative and quantitative data can provide a better understanding of the genetic diversity contained in the germ-plasm bank and a more complete characterization of the genotypes, thus contributing to determine future strategies for the breeding. In view of the importance of the quantitative and qualitative traits for the elephant-grass, it can be said that this kind of analysis herein presented provided greater support and understanding of the diversity among the genotypes under study. Furthermore, the results of the joint analysis of data motivate the curators of germ-plasm collections to carry out characterization works of their collections as fully as possible, in order to generate more reliable information about genetic variability and divergence among the accessions.
Conclusion
There is a wide genetic diversity among the accessions in the elephant-grass germ-plasm under evaluation, which enables the selection of divergent parents for the breeding program. Some accessions show genetic distances lower than 0.1, which indicates there are duplicates in the germ-plasm bank.
About the Authors
Corresponding Author
A.K.F. Vidal
Universidade Estadual do Norte Fluminense Darcy Ribeiro, Campos dos Goytacazes, RJ, Brazil
- Email:
- anakesia.vidal@hotmail.com
References
- Allard RW (1971) Princípios do melhoramento genético das plantas. New York J Willey, USA p: 381.
- Azevedo ALS, Costa PP, Machado JC, Machado MA, et al. (2012) Cross-species amplification of Pennisetum glaucum microsatellite markers in Pennisetum purpureum and genetic diversity of Napier grass accessions. Crop Sci 52: 1776–1785. https://dx.doi.org/10.2135/cropsci2011.09.0480.
- Campos AL, Zacarias AJ, Costa DL, Neves LG, et al. (2010) Avaliação de acessos de mandioca do banco de germoplasma da UNEMAT Cáceres – Mato Grosso. Revista Trópica – Ciências Agrárias e Biológicas, 4: 2.
- Cavalcante M and Lira MA (2010) Variabilidade genética em Pennisetum purpureum Schumacher. Revista Caatinga 23: 153-163. http://periodicos.ufersa.edu.br/index.php/sistema
- Chotiyarnwong O, Chatwachirawong P, Chanprame S and Srinives P (2007) Evaluation of genetic diversity in Thai indigenous and recommended soybean varieties by simple sequence repeat markers. Thai J Agri Sci 40: 119-126.
- Cruz CD (2013) GENES - A software package for analysis in experimental statistics and quantitative genetics. Acta Scientiarum 35: 271- 276. http://dx.doi.org/10.4025/actasciagron.v35i3.21251
- Daher RF, Moraes CF, Cruz CD, Pereira AV, et al. (1997) Selection of discriminant morphological traits in elephantgrass (Pennisetum purpureum Schum.). Revista Da Sociedade Brasileira De Zootecnia. 26: 247-254.
- Gonçalves LSA, Rodrigues R, Sudré CP, Bento CS, et al. (2008) Divergência genética em tomate estimada por marcadores RAPD em comparação com descritores multicategóricos. Horticultura Brasileira 26: 362-368. http://dx.doi.org/10.1590/S0102-05362008000300014
- Gower JC (1971) A general coefficient of similarity and some of its properties. Biometrics, Arlington 27: 857-874. https://doi.org/10.2307/2528823
- Ledo AS, Silva Junior JF and Silva SO (2008) Avaliação de genótipos de bananeira na região do baixo São Francisco, Sergipe. Revista Brasileira. Fruticultura, 30: 691-695. http://dx.doi.org/10.1590/S0100-29452008000300022
- Marim BG, Silva, DJH, Carneiro PCS, Miranda GV, et al. (2009) Variabilidade genética e importância relativa de caracteres em acessos de germoplasma de tomateiro. Pesquisa Agropecuária Brasileira 44: 1283-1290. https://doi.org/10.1590/s0100-204x2009001000011
- Pereira AV, Auad AM, Lédo FJS and Barbosa S (2010) Pennisetum purpureum. In: Fonseca, D. M.; Martuscell o, J. A. (Ed) Plantas Forrageiras. Viçosa: UFV 6: 197-219.
- Pereira AV, Machado MA, Azevedo, ALS, Nascimento, et al. (2008). Diversidade genética entre acessos de capim-elefante obtida por marcadores moleculares. Revista Brasileira de Zootecnia, 1216-1221. http://dx.doi.org/10.1590/S1516-35982008000700011
- R Development Core Team, (2006) A language and environment for statistical computing. Vienna: R Foundation for Statistical Computing.
- Scott AJA and Knott M (1974) Cluster analysis method for grouping means in the analysis of variance. Biometrics 30: 507-512. https://doi.org/10.2307/2529204
- Shimoya A, Cruz CD, Ferreira RP, Pereira VA, et al. (2002) Divergência genética entre acessos de um banco de germoplasma de capim-elefante. Pesquisa Agropecuária Brasileira, 37: 971-980. http://dx.doi.org/10.1590/S0100-204X2002000700011
- Silva FL, Ferreira DCB, Baião ACB, Pereira AA, et al. (2013) Integration of quantitative and multicategorical data in determining the genetic divergence among accessions of coffee trees. Bragantia, 72: 224-229. http://dx.doi.org/10.1590/brag.2013.039
- Struwig M, Mienie CMS, Van Den Berg J, Mucina L, et al. (2009) AFLPs are incompatible with RAPD and morphological data in Pennisetum purpureum (Napier grass). Biochem Syst Ecol 37: 645–652, http://dx.doi.org/10.1016/j. bse.2009.09.010
- Torres FE, Valle CB, Lempp B, Teodoro PE, et al. (2015) Estimativa da divergência entre ecótipos de braquiária baseada em descritores quantitativos e qualitativos. Ciência Rural, 45: 485-491. https://dx.doi.org/10.1590/0103-8478cr20140537
- Vidal AKF, Barbé TC, Daher RF, Almeida Filho JE, et al. (2017) Production potential and chemical composition of elephant grass (Pennisetum purpureum Schum.) at different ages for energy purposes. African Journal of Biotechnology 16: 1428-1433. http://dx.doi.org/10.5897/ajb2017.16014
Keywords:
Download:
Full PDF- Share This