Estimates of genetic parameters and genotypic values prediction in maize landrace populations by REML/BLUP procedure
Published: June 20, 2017
Genet.Mol.Res. 16(2): gmr16029715
DOI: 10.4238/gmr16029715
Abstract
Lung cancer is the leading cause of cancer death in men and the second leading cause of cancer death in women worldwide. Fascin-1 and laminin-5 were associated with the invasiveness and prognoses of several cancers. The expression and the serum levels of fascin-1 and laminin-5 in patients with non-small cell lung cancer (NSCLC) were analyzed in this study. The expression of fascin-1 and laminin-5 were examined in 378 patients and their serum level was measured in 154 patients. The health of all patients was followed post-surgery. The expression of fascin-1 (P = 0.000) and lanminin-5 (P = 0.001) and the serum levels of fascin-1 (P = 0.015) and laminin-5 (P = 0.046) were related to the relapse of patients with NSCLC. Both serum levels and expression of fascin-1 and laminin-5 can be used to effectively evaluate the prognoses of patients with NSCLC.
Introduction
Maize is a crop of international relevance, occupying a prominent position among the agricultural species exploited worldwide, as it is a food of high energetic value and relative low cost, besides being used as raw material in different segments and products, having more than 3500 direct and indirect forms of use. Considering the main cultivated species in the world, maize occupies the third position in terms of cultivated area, but it presents the highest volume of production (Môro and Fritsche-Neto, 2015).
When dealing with the scenario of maize hybrid seeds utilization, conventional or transgenic, along with the use of formulated fertilizers and other agricultural inputs, it must be considered the stratification or establishment of areas of utilization for maize cultivation in the national agriculture. According to available statistical data, the percentage of Brazilian farms that would fit the use of last generation hybrid maize genotypes is very low, among them, the recently released transgenic hybrids. As a result, it is important to implement and constantly search for alternatives within the maize germplasm available in breeding programs and among plant populations traditionally used in agriculture of low employment of modern technological factors (Silveira et al., 2015).
Landrace maize populations, also known as local varieties, are important genetic constituents for genetic breeding programs because of their high adaptive potential for specific environmental conditions (Paterniani et al., 2000). The use of landrace populations present several advantages linked to the sustainability of production, as resistance to diseases, pests and climatic unbalances; also the seeds can be stored and used in the following years, which reduces the cost of production (Carpentieri-Pípolo et al., 2010).
According to Borges et al. (2010) genotype inferences, at any stage of a breeding program, should be based on genotypic and non-phenotypic means, since they reflect future averages when submitted to commercial farming areas.
The consideration of treatment effects as random is significant in genetic plant breeding, because only then the genetic selection can be more efficiently done. Resende (2007b) recommends that, to choose between random and fixed model, the first one should be adopted when the number of treatments in question is more than five, and the fixed model should be used when the number of treatments is smaller.
The mixed models have been frequently used in perennial plants such as eucalyptus (Rosado et al., 2012; Santos et al., 2013), Brazil nut (Camargo et al., 2010), coffee (Carias et al., 2014), sweet potato (Borges et al., 2010), wheat (Pimentel et al., 2014), sugar cane (Bastos et al., 2007), and popcorn (Freitas et al., 2013). However, in the case of maize landrace populations, there is still a small amount of papers using this theory, especially focusing on the evaluation of these populations’ potential in crosses.
Therefore, the present study aims to determine the genetic potential in crosses of landrace populations applying the REML/BLUP methodology, and to identify populations for the synthesis of new populations and intrapopulation selection for family farming systems, as well as genetic constitutions for use in maize breeding programs.
Materials and Methods
Plant material
Seeds of nine maize populations and a variety of open pollination were collected in the municipality of Canguçu, about 50 km from Universidade Federal de Pelotas (UFPel), at the Union of Small Producers of Landraces Corn Seeds, which has been working together with the Center of Genomics and plant breeding (CGF) of UFPel.
The seeds were sown and the crosses were performed in the 2012/2013 growing season between the populations Argentino Branco x BRS Planalto, Dente Ouro x BRS Planalto, Amarelão x BRS Planalto, Criolão x BRS Planalto, Caiano Rajado x BRS Planalto, Branco Oito Carreiras x BRS Planalto, Branco Roxo Índio x BRS Planalto, Cateto Branco x BRS Planalto, and Argentino Amarelo x BRS Planalto, originating nine top crosses. In the agricultural crop 2013/2014 the populations were sown along with the top crosses, other four commercial hybrids were sow: Coodetec 308, Pioneer 30F53, Agroeste 1551 VTPRO, and Agroeste 1590, and also all populations involved in the crosses, resulting in 22 treatments.
Experimental design
The experiment was conducted at the experimental area of the Center of Genomics and plant breeding of UFPel, city of Capão do Leão, with geographic coordinates of 31º52'00"S and 52º21'24"O, and 13 m in altitude. The soil was classified as dystrophic yellow red Argisol (Santos et al., 2006).
It was used a complete randomized block design with three repetitions. The experimental plots consisted of two rows of 5 m in length, with 42 plants per plot, spaced 0.7 m between rows, corresponding to a sowing density of 60,000 plants/ha.
Assessed traits
The following agronomic traits were evaluated in each experimental plot: 1) leaf angle (LA), it refers to the measurement of the first leaf just below the first ear in three plants, given in degrees; 2) number of branches of the tassel (NBT): it refers to the total number of branches of the tassel, given in units; 3) ear insertion height (EIH): it refers to the height from the soil to the insertion of the first ear, given in cm; 4) plant height (PH): it refers to the height from the soil to the insertion of the node of the last leaf, given in cm; 5) ear diameter (ED): it refers to the average diameter of the central part of three ears, given in mm; 6) number of kernels per ear (NKE): it refers to the average of the total number of kernels in three ears, given in units; 7) kernel mass per ear (KME): it refers to the average of total kernel weight of three ears, obtained by precision scale, given in g; 8) ear mass (EM): it refers to the average weight of three ears before processing, obtained by precision scale, given in g; 9) ear length (EL): it refers to the average of total length of three ears, given in cm; 10) prolificity (PRO): it refers to the ratio between the total number of ears by the total number plants in the plot, given in units; 11) one hundred-kernel mass (HKM): it refers to the average of eight assessments of hundred-kernel mass each plot, given in g; 12) grain yield per plot (GY): it refers to the total grain yield, adjusted to 42 plants per plot and 13% moisture, given in kg per plot.
Statistical analysis
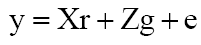
The variance components and genetic parameters were obtained using the Selegen-REML/BLUP software (Resende, 2007a), model 21 (randomized blocks, autogamous or hybrid test, plot mean) denoted in matrix form by:
 (Equation 1)
where y is the data vector, r is the vector of replications effects (assumed to be fixed) plus the general mean, g is the vector of genotypic effects (assumed to be random), and e is the vector of errors (random), and X and Z, matrices of incidence for these effects (Resende, 2002).
The deviances were obtained by analyzing the model with and without the h2 values for each trait, and then subtracting and confronting them with the chi-square value with 1 and 5% degrees of freedom of probability, respectively (Resende, 2007a).
Results and Discussion
Table 1 shows the deviance values for the studied traits. These results demonstrate the existence of a significant difference by the chi-square test at 5% of probability, for the genotype effect, as well as its components of variance ( ) and determination coefficients (
 ) of the respective effect. Therefore, the deviance analysis evidenced the presence of genetic difference among the genotypes analyzed for all evaluated traits.
| LA | Effect | Deviance | LRT | Var. Comp. | Determ. Coef. |
| Genotypes | 301.10 | 40.88** |  |
 |
|
| Complete Model | 260.22 | ||||
| NBT | Effect | Deviance | LRT | Var. Comp. | Determ. Coef. |
| Genotypes | 255.83 | 77.17** |  |
 |
|
| Complete Model | 178.66 | ||||
| EIH | Effect | Deviance | LRT | Var. Comp. | Determ. Coef. |
| Genotypes | 439.86 | 53.69** |  |
 |
|
| Complete Model | 386.17 | ||||
| PH | Effect | Deviance | LRT | Var. Comp. | Determ. Coef. |
| Genotypes | 485.56 | 48.35** |  |
 |
|
| Complete Model | 437.21 | ||||
| ED | Effect | Deviance | LRT | Var. Comp. | Determ. Coef. |
| Genotypes | 232.98 | 52.77** |  |
 |
|
| Complete Model | 180.21 | ||||
| NKE | Effect | Deviance | LRT | Var. Comp. | Determ. Coef. |
| Genotypes | 661.00 | 46.11** |  |
 |
|
| Complete Model | 614.89 | ||||
| KME | Effect | Deviance | LRT | Var. Comp. | Determ. Coef. |
| Genotypes | 654.63 | 82.69** |  |
 |
|
| Complete Model | 571.94 | ||||
| EM | Effect | Deviance | LRT | Var. Comp. | Determ. Coef. |
| Genotypes | 662.31 | 66.92** |  |
 |
|
| Complete Model | 595.39 | ||||
| EL | Effect | Deviance | LRT | Var. Comp. | Determ. Coef. |
| Genotypes | 155.72 | 27.22** |  |
 |
|
| Complete Model | 128.5 | ||||
| PRO | Effect | Deviance | LRT | Var. Comp. | Determ. Coef. |
| Genotypes | -137.02 | 17.54** |  |
 |
|
| Complete Model | -154.56 | ||||
| HKM | Effect | Deviance | LRT | Var. Comp. | Determ. Coef. |
| Genotypes | 275.49 | 46.63** |  |
 |
|
| Complete Model | 228.86 | ||||
| GY | Effect | Deviance | LRT | Var. Comp. | Determ. Coef. |
| Genotypes | 158.46 | 86.48** |  |
 |
|
| Complete Model | 71.98 |
*Significant at 5% of probability of error by the chi-square test. **Significant at 1% of probability of error by the chi-square test for the variables, and nsnon-significant.
Table 1: Deviance values for nine landrace maize top cross hybrids with the tester BRS Planalto, eight genitors and four commercial witnesses for the traits leaf angle (LA), number of branches of the tassel (NBT), ear insertion height (EIH), plant height (PH), ear diameter (ED), number of kernels per ear (NKE), kernel mass per ear (KME), ear mass (EM), ear length (EL), prolificity (PRO), one hundred-kernel mass (HKM), and grain yield per plot (GY), in the 2013/2014 agricultural year.
The results concerning genetic parameters estimates for the traits on study are presented in Table 2. The coefficient of genetic variation (CVg) is a parameter commonly used to compare the genetic variability evidenced for each trait, as quoted by Resende (2002). The coefficients of genetic variation (CVgi) were moderate to high for all analyzed traits, ranging between 7.276% for ear diameter and 37.739% for grain yield per plot, allowing to infer that the evaluated genotypes present high genetic variability. The values for the coefficient of residual variation (CVe) were considered mean to low, with values ranging from 12.336% (prolificity) to 3.349% (ear diameter).
| Estimates | LA | MHG | NRT | SIH | PH | SD | NGS | SM | MGS | PRO | SL | GY |
|---|---|---|---|---|---|---|---|---|---|---|---|---|
| 28.805 | 20.019 | 16.674 | 283.582 | 568.022 | 10.577 | 9,066.981 | 10,250.901 | 9,482.539 | 0.020 | 2.467 | 3.631 | |
| 8.989 | 5.153 | 1.750 | 58.406 | 138.322 | 2.241 | 2,373.475 | 1,430.093 | 857.621 | 0.016 | 1.294 | 0.297 | |
| 37.794 | 25.172 | 18.424 | 341.987 | 706.344 | 12.819 | 11,440.457 | 11,680.994 | 10,340.160 | 0.036 | 3.760 | 3.928 | |
| 0.762 |
0.795 |
0.905 |
0.829 |
0.804 |
0.825 |
0.792 |
0.877571 |
0.917 |
0.544 |
0.656 |
0.924 |
|
| 0.906 | 0.921 | 0.966 | 0.936 | 0.925 | 0.934 | 0.920 | 0.955 | 0.971 | 0.782 | 0.851 | 0.973 | |
| Aclinh | 0.952 | 0.960 | 0.983 | 0.967 | 0.962 | 0.966 | 0.959 | 0.977 | 0.985 | 0.884 | 0.923 | 0.987 |
| CVgi (%) | 19.206 | 11.153 | 26.504 | 14.039 | 10.611 | 7.276 | 22.005 | 17.272 | 19.706 | 13.482 | 8.621 | 37.739 |
| CVe (%) | 10.729 | 5.658 | 8.587 | 6.371 | 5.236 | 3.349 | 11.259 | 6.451 | 5.926 | 12.336 | 6.243 | 10.792 |
| CVr | 1.790 | 1.971 | 3.087 | 2.203 | 2.026 | 2.172 | 1.952 | 2.677 | 3.325 | 1.093 | 1.381 | 3.497 |
| GA | 27.945 | 40.118 | 15.407 | 119.947 | 224.609 | 44.699 | 432.720 | 586.175 | 494.151 | 1.039 | 18.219 | 5.049 |
Table 2: Genetic parameters estimates of nine landrace maize top cross hybrids, tester BRS Planalto, eight genitors and four commercial witnesses for the traits leaf angle (LA), number of branches of the tassel (NBT), ear insertion height (EIH), plant height (PH), ear diameter (ED), number of kernels per ear (NKE), kernel mass per ear (KME), ear mass (EM), ear length (EL), prolificity (PRO), hundred-kernel mass (HKM), and grain yield per plot (GY), in the 2013/2014 agricultural year.
The magnitude of CVe is associated with the experimental accuracy and way of measurement of the set of analyzed traits. The prolificity, in general, presented higher values of this coefficient, because it is a trait obtained by two other traits, accumulating the measurement errors of these two. However, the coefficients of variation of all traits are within acceptable limits for agricultural experimentation, according to Scapim et al. (1995) and Pimentel-Gomes (2009). According to Vencovsky (1987), when a relation between CVgi and coefficient of residual variation CVe of 1 or more is evidenced, a favorable situation to achieve gains in the selection occurs. Therefore, considering the relation between CVgi and CVe evidenced by CVr for all traits, CVgi was superior to CVe, which indicates favorable gains with the selection, highlighting the trait grain yield, with the highest magnitude for this coefficient.
The heritability estimates revealed the reliability of the phenotypic value as indicator of reliability. For this reason, heritability almost always participates in expressions related to the prediction of gains of different breeding methods and, as a consequence, of the decisions that breeders make conducting their selection programs (Ramalho et al., 2012). The coefficient of individual heritability in the broad sense (
The selective accuracy (Aclinh) reflects the quality of results and procedures used to predict genetic values. This parameter is associated to the accuracy of selection and refers to the correlation between predicted genetic values and true genetic values of individuals (Pimentel et al., 2014). The results of selective accuracy presented an amplitude of 0.884 for prolificity and 0.987 for grain yield, being considered of high magnitude. This statistic ranges from 0 to 1 and, according to Resende and Duarte (2007), it may be classified as very high (Aclinh ≥ 0.90), high (0.70 ≤ Aclinh �?�? 0.90), moderate (0.50 ≤ Aclinh �?�? 0.70) and low (Aclinh �?�? 0.50). Values of accuracy higher than 0.70 are sufficient to provide a precise and efficient inference about the genetic value of genotypes, and as it is a measure associated with precision in selection, accuracy is the main element of genetic progress that may be altered by the breeder, allowing to maximize genetic gains (Resende, 2002).
Tables 3, 4 and 5
| LA (degrees) | HKM (g) | NBT (cm) | EIH (cm) | ||||||||||||||||||||
|---|---|---|---|---|---|---|---|---|---|---|---|---|---|---|---|---|---|---|---|---|---|---|---|
| Ord | Gen1 | g | g + μ | Gain | New mean | Ord | Gen | g | g + μ | Gain | New mean | Ord | Gen | g | g + μ | Gain | New mean | Ord | Gen | g | g + μ | Gain | New mean |
| 1 | 20 | 8.67 | 36.62 | 8.67 | 36.62 | 1 | 17 | 9.76 | 49.88 | 9.76 | 49.88 | 1 | 6 | 7.41 | 22.82 | 7.41 | 22.82 | 1 | 19 | 22.51 | 142.45 | 22.51 | 142.45 |
| 2 | 6 | 8.01 | 35.96 | 8.34 | 36.29 | 2 | 20 | 8.38 | 48.50 | 9.07 | 49.19 | 2 | 21 | 5.94 | 21.35 | 6.68 | 22.08 | 2 | 6 | 19.49 | 139.44 | 21.00 | 140.95 |
| 3 | 17 | 5.08 | 33.03 | 7.26 | 35.20 | 3 | 2 | 5.33 | 45.45 | 7.83 | 47.94 | 3 | 18 | 3.98 | 19.39 | 5.78 | 21.19 | 3 | 16 | 17.73 | 137.67 | 19.91 | 139.86 |
| 4 | 16 | 4.78 | 32.73 | 6.64 | 34.58 | 4 | 14 | 3.21 | 43.32 | 6.67 | 46.79 | 4 | 16 | 3.31 | 18.71 | 5.16 | 20.57 | 4 | 18 | 17.35 | 137.30 | 19.27 | 139.22 |
| 5 | 8 | 4.38 | 32.32 | 6.19 | 34.13 | 5 | 19 | 2.62 | 42.74 | 5.86 | 45.98 | 5 | 3 | 2.72 | 18.12 | 4.67 | 20.08 | 5 | 9 | 15.96 | 135.90 | 18.61 | 138.55 |
| 6 | 22 | 3.67 | 31.62 | 5.77 | 33.71 | 6 | 8 | 2.15 | 42.27 | 5.24 | 45.36 | 6 | 9 | 2.40 | 17.81 | 4.29 | 19.70 | 6 | 4 | 15.23 | 135.17 | 18.04 | 137.99 |
| 7 | 19 | 3.37 | 31.32 | 5.43 | 33.37 | 7 | 3 | 1.44 | 41.55 | 4.70 | 44.82 | 7 | 4 | 2.10 | 17.51 | 3.98 | 19.39 | 7 | 17 | 13.46 | 133.41 | 17.39 | 137.34 |
| 8 | 9 | 3.07 | 31.01 | 5.13 | 33.08 | 8 | 18 | 1.07 | 41.19 | 4.25 | 44.36 | 8 | 17 | 1.54 | 16.95 | 3.68 | 19.08 | 8 | 5 | 12.32 | 132.27 | 16.76 | 136.70 |
| 9 | 1 | 2.11 | 30.05 | 4.79 | 32.74 | 9 | 4 | 1.06 | 41.17 | 3.89 | 44.01 | 9 | 8 | 1.22 | 16.63 | 3.40 | 18.81 | 9 | 2 | 8.99 | 128.94 | 15.89 | 135.84 |
| 10 | 2 | 0.60 | 28.54 | 4.37 | 32.32 | 10 | 5 | -0.04 | 40.07 | 3.50 | 43.62 | 10 | 5 | 1.11 | 16.52 | 3.17 | 18.58 | 10 | 8 | 8.47 | 128.42 | 15.15 | 135.10 |
| 11 | 5 | 0.29 | 28.24 | 4.00 | 31.95 | 11 | 11 | -0.15 | 39.97 | 3.17 | 43.28 | 11 | 19 | 0.89 | 16.30 | 2.97 | 18.37 | 11 | 1 | 0.78 | 120.73 | 13.84 | 133.79 |
| 12 | 14 | -0.05 | 27.90 | 3.67 | 31.61 | 12 | 1 | -0.30 | 39.81 | 2.88 | 42.99 | 12 | 14 | 0.59 | 16.00 | 2.77 | 18.18 | 12 | 20 | -1.72 | 118.23 | 12.55 | 132.50 |
| 13 | 3 | -0.61 | 27.33 | 3.34 | 31.28 | 13 | 13 | -1.24 | 38.88 | 2.56 | 42.68 | 13 | 20 | -0.18 | 15.23 | 2.54 | 17.95 | 13 | 13 | -5.88 | 114.07 | 11.13 | 131.08 |
| 14 | 21 | -0.65 | 27.29 | 3.05 | 31.00 | 14 | 7 | -1.33 | 38.79 | 2.28 | 42.40 | 14 | 15 | -0.61 | 14.80 | 2.32 | 17.72 | 14 | 22 | -7.08 | 112.87 | 9.83 | 129.78 |
| 15 | 18 | -2.01 | 25.93 | 2.71 | 30.66 | 15 | 6 | -1.74 | 38.38 | 2.01 | 42.13 | 15 | 7 | -0.72 | 14.69 | 2.11 | 17.52 | 15 | 7 | -7.12 | 112.82 | 8.70 | 128.65 |
| 16 | 7 | -2.66 | 25.28 | 2.38 | 30.32 | 16 | 15 | -1.74 | 38.37 | 1.78 | 41.90 | 16 | 1 | -1.79 | 13.62 | 1.87 | 17.28 | 16 | 14 | -8.07 | 111.88 | 7.65 | 127.60 |
| 17 | 15 | -2.77 | 25.18 | 2.08 | 30.02 | 17 | 9 | -2.05 | 38.07 | 1.55 | 41.67 | 17 | 22 | -1.90 | 13.51 | 1.65 | 17.06 | 17 | 15 | -9.97 | 109.98 | 6.62 | 126.56 |
| 18 | 11 | -4.48 | 23.47 | 1.71 | 29.66 | 18 | 10 | -2.21 | 37.91 | 1.35 | 41.46 | 18 | 2 | -2.00 | 13.40 | 1.45 | 16.85 | 18 | 3 | -13.25 | 106.69 | 5.51 | 125.46 |
| 19 | 13 | -4.88 | 23.07 | 1.36 | 29.31 | 19 | 21 | -5.17 | 34.94 | 1.00 | 41.12 | 19 | 10 | -3.92 | 11.49 | 1.16 | 16.57 | 19 | 10 | -15.54 | 104.40 | 4.40 | 124.35 |
| 20 | 4 | -5.59 | 22.35 | 1.02 | 28.96 | 20 | 12 | -5.66 | 34.46 | 0.67 | 40.79 | 20 | 11 | -5.44 | 9.97 | 0.83 | 16.24 | 20 | 12 | -24.70 | 95.25 | 2.95 | 122.90 |
| 21 | 10 | -10.12 | 17.83 | 0.49 | 28.43 | 21 | 16 | -6.49 | 33.62 | 0.33 | 40.45 | 21 | 12 | -7.37 | 8.04 | 0.44 | 15.85 | 21 | 21 | -25.63 | 94.31 | 1.59 | 121.53 |
| 22 | 12 | -10.22 | 17.73 | 0.00 | 27.95 | 22 | 22 | -6.89 | 33.22 | 0.00 | 40.12 | 22 | 13 | -9.30 | 6.11 | 0.00 | 15.41 | 22 | 11 | -33.33 | 86.62 | 0.00 | 119.95 |
11 = Argentino Branco x Planalto, 2 = Branco Roxo Índio x Planalto, 3 = Amarelão x Planalto, 4 = Caiano Rajado x Planalto, 5 = Argentino Amarelo x Planalto, 6 = Dente de Ouro x Planalto, 7 = Cateto Branco x Planalto, 8 = Branco 8 Carreiras x Planalto, 9 = Criolão x Planalto, 10 = Agroceres 1590, 11 = Coodetec 308, 12 = Agroeste 1551 VT PRO 2, 13 = Pioneer 30F53H, 14 = Planalto, 15 = Argentino Branco, 16 = Dente Ouro, 17 = Amarelão, 18 = Criolão, 19 = Caiano Rajado, 20 = Branco Oito Carreiras, 21 = Cateto Branco, and 22 = Argentino Amarelo.
Table 3: Ordering (Ord), genotypes (Gen), predicted genotypic effect (g), genotypic values (g + μ), predicted genetic gains (Gain), and new population mean (New mean) in nine landrace maize top cross hybrids, tester BRS Planalto, eight genitors and four commercial witnesses for the traits leaf angle (LA), number of branches of the tassel (NBT), ear insertion height (EIH), hundred-kernel mass (HKM), in the 2013/2014 agricultural year. CGF/FAEM-UFPel, Pelotas, RS, Brazil.
| PH (cm) | ED (g) | NKE (un.) | KME (g) | ||||||||||||||||||||
|---|---|---|---|---|---|---|---|---|---|---|---|---|---|---|---|---|---|---|---|---|---|---|---|
| Ord | Gen1 | g | g + μ | Gain | New mean | Ord | Gen | g | g + μ | Gain | New mean | Ord | Gen | g | g + μ | Gain | New mean | Ord | Gen | g | g + μ | Gain | New mean |
| 1 | 16 | 35.64 | 260.25 | 35.64 | 36.62 | 1 | 13 | 5.7793 | 50.4784 | 5.7793 | 36.62 | 1 | 13 | 274.51 | 707.23 | 274.51 | 707.23 | 1 | 13 | 233.54 | 727.69 | 233.54 | 727.69 |
| 2 | 9 | 35.45 | 260.06 | 35.54 | 260.15 | 2 | 12 | 3.30 | 48.00 | 4.54 | 49.24 | 2 | 12 | 124.22 | 556.94 | 199.36 | 632.08 | 2 | 12 | 105.20 | 599.35 | 169.37 | 663.52 |
| 3 | 6 | 23.90 | 248.51 | 31.66 | 256.27 | 3 | 11 | 3.22 | 47.92 | 4.10 | 48.80 | 3 | 10 | 76.87 | 509.59 | 158.53 | 591.25 | 3 | 8 | 96.90 | 591.05 | 145.21 | 639.36 |
| 4 | 19 | 21.53 | 246.14 | 29.13 | 253.74 | 4 | 2 | 2.73 | 47.43 | 3.76 | 48.46 | 4 | 6 | 65.76 | 498.48 | 135.34 | 568.06 | 4 | 10 | 63.35 | 557.50 | 124.75 | 618.90 |
| 5 | 14 | 18.17 | 242.78 | 26.94 | 251.55 | 5 | 4 | 2.62 | 47.32 | 3.53 | 48.23 | 5 | 14 | 38.65 | 471.37 | 116.00 | 548.72 | 5 | 3 | 58.25 | 552.40 | 111.45 | 605.60 |
| 6 | 5 | 15.06 | 239.67 | 24.96 | 249.57 | 6 | 14 | 2.05 | 46.75 | 3.28 | 47.98 | 6 | 8 | 25.36 | 458.08 | 100.89 | 533.61 | 6 | 9 | 49.35 | 543.51 | 101.10 | 595.25 |
| 7 | 1 | 11.26 | 235.87 | 23.00 | 247.61 | 7 | 3 | 1.16 | 45.86 | 2.98 | 47.68 | 7 | 7 | 24.41 | 457.13 | 89.97 | 522.69 | 7 | 6 | 45.84 | 539.99 | 93.21 | 587.36 |
| 8 | 4 | 11.15 | 235.76 | 21.52 | 246.13 | 8 | 7 | 1.13 | 45.83 | 2.75 | 47.45 | 8 | 9 | 21.55 | 454.27 | 81.42 | 514.14 | 8 | 14 | 42.78 | 536.93 | 86.90 | 581.05 |
| 9 | 2 | 11.05 | 235.66 | 20.36 | 244.97 | 9 | 8 | 1.08 | 45.77 | 2.56 | 47.26 | 9 | 1 | 9.42 | 442.14 | 73.42 | 506.14 | 9 | 7 | 37.97 | 532.12 | 81.47 | 575.62 |
| 10 | 18 | 10.84 | 235.45 | 19.41 | 244.01 | 10 | 6 | 0.54 | 45.24 | 2.36 | 47.06 | 10 | 11 | 8.12 | 440.84 | 66.89 | 499.61 | 10 | 2 | 37.05 | 531.20 | 77.02 | 571.18 |
| 11 | 22 | 0.59 | 225.20 | 17.69 | 242.30 | 11 | 20 | 0.18 | 44.87 | 2.16 | 46.86 | 11 | 4 | 6.70 | 439.42 | 61.42 | 494.14 | 11 | 4 | 27.89 | 522.04 | 72.56 | 566.71 |
| 12 | 15 | -2.00 | 222.61 | 16.05 | 240.66 | 12 | 10 | -0.08 | 44.62 | 1.97 | 46.67 | 12 | 5 | 5.67 | 438.39 | 56.77 | 489.49 | 12 | 20 | 16.61 | 510.77 | 67.90 | 562.05 |
| 13 | 20 | -2.31 | 222.30 | 14.64 | 239.25 | 13 | 16 | -0.27 | 44.43 | 1.80 | 46.50 | 13 | 3 | -12.65 | 420.07 | 51.43 | 484.15 | 13 | 16 | -9.93 | 484.23 | 61.91 | 556.06 |
| 14 | 3 | -2.31 | 222.30 | 13.43 | 238.04 | 14 | 1 | -0.39 | 44.30 | 1.65 | 46.34 | 14 | 19 | -16.54 | 416.18 | 46.58 | 479.30 | 14 | 5 | -18.05 | 476.10 | 56.20 | 550.35 |
| 15 | 17 | -4.16 | 220.45 | 12.26 | 236.87 | 15 | 19 | -0.73 | 43.97 | 1.49 | 46.19 | 15 | 16 | -24.64 | 408.08 | 41.83 | 474.55 | 15 | 1 | -18.88 | 475.27 | 51.19 | 545.34 |
| 16 | 8 | -4.78 | 219.83 | 11.19 | 235.80 | 16 | 9 | -0.92 | 43.78 | 1.34 | 46.04 | 16 | 2 | -25.39 | 407.33 | 37.63 | 470.35 | 16 | 11 | -28.20 | 465.95 | 46.23 | 540.38 |
| 17 | 13 | -9.30 | 215.31 | 9.99 | 234.60 | 17 | 5 | -0.98 | 43.72 | 1.20 | 45.90 | 17 | 20 | -56.19 | 376.53 | 32.11 | 464.83 | 17 | 19 | -62.06 | 432.09 | 39.86 | 534.01 |
| 18 | 10 | -15.87 | 208.74 | 8.55 | 233.16 | 18 | 17 | -1.16 | 43.54 | 1.07 | 45.77 | 18 | 21 | -65.66 | 367.06 | 26.68 | 459.40 | 18 | 18 | -98.32 | 395.83 | 32.18 | 526.34 |
| 19 | 7 | -30.36 | 194.24 | 6.50 | 231.11 | 19 | 21 | -1.77 | 42.93 | 0.92 | 45.62 | 19 | 22 | -80.92 | 351.80 | 21.01 | 453.73 | 19 | 17 | -126.13 | 368.02 | 23.85 | 518.00 |
| 20 | 12 | -37.56 | 187.05 | 4.30 | 228.91 | 20 | 18 | -3.36 | 41.34 | 0.71 | 45.40 | 20 | 18 | -110.42 | 322.30 | 14.44 | 447.16 | 20 | 21 | -127.98 | 366.17 | 16.26 | 510.41 |
| 21 | 21 | -42.49 | 182.12 | 2.07 | 226.68 | 21 | 15 | -4.59 | 40.11 | 0.45 | 45.15 | 21 | 15 | -121.25 | 311.47 | 7.98 | 440.70 | 21 | 15 | -148.35 | 345.80 | 8.42 | 502.57 |
| 22 | 11 | -43.49 | 181.11 | 0.00 | 224.61 | 22 | 22 | -9.53 | 35.17 | 0.00 | 44.70 | 22 | 17 | -167.58 | 265.14 | 0.00 | 432.72 | 22 | 22 | -176.85 | 317.30 | 0.00 | 494.15 |
11 = Argentino Branco x Planalto, 2 = Branco Roxo Índio x Planalto, 3 = Amarelão x Planalto, 4 = Caiano Rajado x Planalto, 5 = Argentino Amarelo x Planalto, 6 = Dente de Ouro x Planalto, 7 = Cateto Branco x Planalto, 8 = Branco 8 Carreiras x Planalto, 9 = Criolão x Planalto, 10 = Agroceres 1590, 11 = Coodetec 308, 12 = Agroeste 1551 VT PRO 2, 13 = Pioneer 30F53H, 14 = Planalto, 15 = Argentino Branco, 16 = Dente Ouro, 17 = Amarelão, 18 = Criolão, 19 = Caiano Rajado, 20 = Branco Oito Carreiras, 21 = Cateto Branco, and 22 = Argentino Amarelo.
Table 4: Ordering (Ord), genotypes (gen), predicted genotypic effect (g), genotypic values (g + u), predicted genetic gains and new population mean in nine landrace maize top cross hybrids, tester BRS Planalto, eight genitors and four commercial witnesses for the traits plant height (PH), ear diameter (ED), number of kernels per ear (NKE) and kernel mass per ear (KME) in the 2013/2014 agricultural year. CGF/FAEM-UFPel, Pelotas, RS, Brazil.
| EM (g) | PRO (un.) | EL (cm) | GY (kg) | ||||||||||||||||||||
|---|---|---|---|---|---|---|---|---|---|---|---|---|---|---|---|---|---|---|---|---|---|---|---|
| Ord | Gen1 | g | g + μ | Gain | New mean | Ord | Gen | g | g + μ | Gain | New mean | Ord | Gen | g | g + μ | Gain | New mean | Ord | Gen | g | g + μ | Gain | New mean |
| 1 | 13 | 226.51 | 812.69 | 226.51 | 36.62 | 1 | 5 | 0.32 | 1.36 | 0.32 | 36.62 | 1 | 13 | 2.84 | 21.06 | 2.84 | 36.62 | 1 | 12 | 3.54 | 8.59 | 3.54 | 8.59 |
| 2 | 8 | 100.91 | 687.09 | 163.71 | 749.89 | 2 | 19 | 0.24 | 1.27 | 0.28 | 1.31 | 2 | 9 | 1.70 | 19.92 | 2.27 | 20.49 | 2 | 13 | 2.23 | 7.28 | 2.89 | 7.94 |
| 3 | 12 | 94.70 | 680.88 | 140.71 | 726.88 | 3 | 14 | 0.10 | 1.14 | 0.22 | 1.26 | 3 | 7 | 1.37 | 19.59 | 1.97 | 20.19 | 3 | 10 | 2.17 | 7.22 | 2.65 | 7.70 |
| 4 | 9 | 67.06 | 653.23 | 122.30 | 708.47 | 4 | 6 | 0.08 | 1.12 | 0.18 | 1.22 | 4 | 4 | 1.33 | 19.54 | 1.81 | 20.03 | 4 | 11 | 1.54 | 6.59 | 2.37 | 7.42 |
| 5 | 14 | 56.50 | 642.68 | 109.14 | 695.31 | 5 | 11 | 0.07 | 1.11 | 0.16 | 1.20 | 5 | 20 | 1.28 | 19.50 | 1.70 | 19.92 | 5 | 14 | 1.51 | 6.56 | 2.20 | 7.25 |
| 6 | 7 | 51.06 | 637.24 | 99.46 | 685.63 | 6 | 15 | 0.07 | 1.11 | 0.14 | 1.18 | 6 | 10 | 1.18 | 19.40 | 1.62 | 19.84 | 6 | 9 | 1.47 | 6.52 | 2.08 | 7.13 |
| 7 | 20 | 46.00 | 632.18 | 91.82 | 678.00 | 7 | 16 | 0.04 | 1.08 | 0.13 | 1.17 | 7 | 14 | 1.09 | 19.31 | 1.54 | 19.76 | 7 | 8 | 1.14 | 6.19 | 1.94 | 6.99 |
| 8 | 4 | 45.65 | 631.83 | 86.05 | 672.23 | 8 | 4 | 0.04 | 1.08 | 0.12 | 1.16 | 8 | 8 | 0.81 | 19.03 | 1.45 | 19.67 | 8 | 4 | 1.07 | 6.12 | 1.84 | 6.88 |
| 9 | 2 | 38.45 | 624.62 | 80.76 | 666.94 | 9 | 13 | 0.04 | 1.08 | 0.11 | 1.15 | 9 | 18 | 0.71 | 18.93 | 1.37 | 19.59 | 9 | 2 | 0.59 | 5.64 | 1.70 | 6.75 |
| 10 | 6 | 31.86 | 618.03 | 75.87 | 662.05 | 10 | 10 | 0.01 | 1.05 | 0.10 | 1.14 | 10 | 3 | 0.58 | 18.80 | 1.29 | 19.51 | 10 | 3 | 0.53 | 5.58 | 1.58 | 6.63 |
| 11 | 3 | 28.97 | 615.15 | 71.61 | 657.78 | 11 | 12 | 0.00 | 1.03 | 0.09 | 1.13 | 11 | 6 | 0.09 | 18.31 | 1.18 | 19.40 | 11 | 7 | 0.24 | 5.29 | 1.46 | 6.51 |
| 12 | 11 | 26.32 | 612.49 | 67.83 | 654.01 | 12 | 8 | -0.01 | 1.03 | 0.08 | 1.12 | 12 | 19 | -0.06 | 18.16 | 1.08 | 19.30 | 12 | 20 | 0.04 | 5.09 | 1.34 | 6.39 |
| 13 | 1 | 6.65 | 592.83 | 63.13 | 649.30 | 13 | 7 | -0.02 | 1.02 | 0.07 | 1.11 | 13 | 5 | -0.19 | 18.03 | 0.98 | 19.20 | 13 | 6 | 0.01 | 5.06 | 1.24 | 6.29 |
| 14 | 10 | 0.13 | 586.30 | 58.63 | 644.80 | 14 | 3 | -0.03 | 1.01 | 0.07 | 1.11 | 14 | 2 | -0.66 | 17.56 | 0.86 | 19.08 | 14 | 1 | -0.36 | 4.69 | 1.12 | 6.17 |
| 15 | 5 | -22.97 | 563.21 | 53.19 | 639.36 | 15 | 1 | -0.04 | 1.00 | 0.06 | 1.10 | 15 | 12 | -0.75 | 17.47 | 0.76 | 18.97 | 15 | 18 | -0.63 | 4.42 | 1.01 | 6.06 |
| 16 | 19 | -23.13 | 563.05 | 48.42 | 634.59 | 16 | 22 | -0.05 | 0.99 | 0.05 | 1.09 | 16 | 1 | -0.80 | 17.42 | 0.66 | 18.88 | 16 | 16 | -0.66 | 4.38 | 0.90 | 5.95 |
| 17 | 16 | -64.26 | 521.92 | 41.79 | 627.96 | 17 | 9 | -0.06 | 0.98 | 0.05 | 1.08 | 17 | 17 | -0.96 | 17.26 | 0.56 | 18.78 | 17 | 22 | -1.09 | 3.96 | 0.79 | 5.84 |
| 18 | 17 | -85.49 | 500.69 | 34.72 | 620.89 | 18 | 20 | -0.10 | 0.94 | 0.04 | 1.08 | 18 | 22 | -1.22 | 16.99 | 0.46 | 18.68 | 18 | 15 | -1.60 | 3.45 | 0.65 | 5.70 |
| 19 | 18 | -97.46 | 488.72 | 27.76 | 613.94 | 19 | 17 | -0.14 | 0.90 | 0.03 | 1.07 | 19 | 11 | -1.37 | 16.85 | 0.37 | 18.59 | 19 | 5 | -1.80 | 3.25 | 0.52 | 5.57 |
| 20 | 21 | -152.06 | 434.12 | 18.77 | 604.95 | 20 | 2 | -0.15 | 0.89 | 0.02 | 1.06 | 20 | 16 | -1.45 | 16.76 | 0.28 | 18.49 | 20 | 17 | -2.53 | 2.52 | 0.37 | 5.42 |
| 21 | 15 | -164.29 | 421.89 | 10.05 | 596.23 | 21 | 18 | -0.17 | 0.87 | 0.01 | 1.05 | 21 | 15 | -2.31 | 15.90 | 0.15 | 18.37 | 21 | 19 | -3.63 | 1.42 | 0.18 | 5.23 |
| 22 | 22 | -211.12 | 375.06 | 0.00 | 586.18 | 22 | 21 | -0.23 | 0.81 | 0.00 | 1.04 | 22 | 21 | -3.21 | 15.01 | 0.00 | 18.22 | 22 | 21 | -3.81 | 1.24 | 0.00 | 5.05 |
11 = Argentino Branco x Planalto, 2 = Branco Roxo Índio x Planalto, 3 = Amarelão x Planalto, 4 = Caiano Rajado x Planalto, 5 = Argentino Amarelo x Planalto, 6 = Dente de Ouro x Planalto, 7 = Cateto Branco x Planalto, 8 = Branco 8 Carreiras x Planalto, 9 = Criolão x Planalto, 10 = Agroceres 1590, 11 = Coodetec 308, 12 = Agroeste 1551 VT PRO 2, 13 = Pioneer 30F53H, 14 = Planalto, 15 = Argentino Branco, 16 = Dente Ouro, 17 = Amarelão, 18 = Criolão, 19 = Caiano Rajado, 20 = Branco Oito Carreiras, 21 = Cateto Branco, and 22 = Argentino Amarelo.
Table 5: Ordering (Ord), genotypes (gen), predicted genotypic effect (g), genotypic values (g + u), predicted genetic gains and new population mean in nine landrace maize top cross hybrids, tester BRS Planalto, eight genitors and four commercial witnesses for the traits ear mass (EM), prolificity (PRO), ear length (EL) and grain yield per plot (GY) in the 2013/2014 agricultural year. CGF/FAEM-UFPel, Pelotas, RS, 2014.
Analyzing the ten best genotypes by order, five (Cateto Branco x Planalto, Agroceres 1590, Coodetec 308, Agroeste 1551 VT PRO 2, and Pioneer 30F53H) of them concomitantly presented the lowest genotypic values for the traits: leaf angle, number of ramifications of the tassel, spike insertion height and plant height; two (Amarelão x Planalto and Cateto Branco) presented the lowest values for leaf angle, spike insertion height and plant height; one (Argentino Branco) showed the smallest magnitudes for leaf angle, number of ramifications of the tassel and spike insertion height, and one (Branco Oito Carreiras) stood out for number of branches of the tassel, spike insertion height and plant height. It was also verified that genotype Argentino Amarelo presented the best performances for number of ramifications of the tassel and spike insertion height. The top cross hybrids Cateto Branco x Planalto, Amarelão x Planalto and the population Cateto Branco evidenced, at the same time, among the ten superior genotypes in four, three and three traits, respectively. These results show the possibility of finding, within these genetic constitutions, individuals that concentrate favorable alleles for this set of traits simultaneously (Tables 3 and 4
The plant size reduction is one goal of selection, according to Jesus Freitas et al. (2013), plants with a higher size and higher spike insertion difficult mechanical harvesting, besides being more susceptible to breaking and lodging, especially when it comes to regions with a high incidence of winds.
Regarding some tassel traits, Duvick and Cassman (1999) relate an important modification made by breeding programs in their group of hybrids grown in the North American corn belt, selecting for tassel size reduction. According to the authors, smaller tassels cause less apical dominance on the spikes, which is very important under stress conditions. In addition, it is possible that the lower expenses by the plant for developing the male inflorescence contributes to a better adaptation on higher plant densities per unit of area. Sangoi et al. (2006), based on the results of an experiment combining three factors: plant population, hybrids and detasseling levels, concluded that tassel removal significantly increased grain yield. The authors found an increase of 7% in average yield of the tested genotypes submitted to detasseling.
For grain yield, the genotypes Agroeste 1551 VT PRO 2, Pioneer 30F53H, Agroceres 1590, Coodetec 308, Planalto, and the crosses Criolão x Planalto, Branco 8 Carreiras x Planalto, Caiano Rajado x Planalto, Branco Roxo Índio x Planalto, and Amarelão x Planalto presented the ten best performances by ordering the genotypic values (Table 5). The top cross hybrid Criolão x Planalto presented, concomitantly, among the top ten for number of grains, mass of grainsper spike, spike mass, spike length; the top cross Branco 8 Carreiras x Planalto, for spike diameter, number of grains, mass of grains per spike, spike mass, spike length, and mass of one hundred grains; the top cross Caiano Rajado x Planalto, for spike diameter, spike mass, prolificity, spike length, and mass of one hundred grains; the top cross Branco Roxo Índio x Planalto, for spike diameter, mass of grains per spike, spike mass, and mass of one hundred grains; and the top cross 3 for spike diameter, mass of grains per spike, spike length, and mass of one hundred grains (Tables 3, 4 and 5
The results show that these top cross hybrids may subsidize the establishment of a genetic breeding program for the species, even presenting inferior performance than the commercial materials regarding grain yield. These genetic constitutions are important because they are a source of genetic variability that can be exploited in the search for genes tolerant and/or resistant to biotic and abiotic factors as reported by Araújo and Nass (2002).
In general, the grain yield of the top cross hybrids and landraces were smaller than the commercial hybrids. However, according to Carpentiere-Pípolo et al. (2010), although they are considered to be less productive than commercial genotypes, they present high productive potential under low technology cultivation conditions. These authors also add that those populations, which have their productivities between 50 and 70% in relation to commercial witnesses, may be useful for breeding if they present other traits of interest.
According to Arnhold et al. (2012), analyzing 128 different maize genotypes in two years, reported a correlation of 0.75 between phenotypic and genotypic means using mixed models, showing that the selection based on phenotypic means may not reflect the selection of the same individuals by genotypic means. The same authors also reported that, in occasion of data loss, the mixed models are preferable. Freitas et al. (2013) evaluated progenies of popcorn half-siblings using the REML/BLUP method, which were highly efficient when confronted with several selection indexes, making it possible to select progenies with high relative performances and promising predicted genetic gains.
Due to the greater variability (CVgi) and heritability coefficient of the trait grain yield in the present study, the genotypic values, as well as their inferior (ILCI) and superior (SLCI) limits of the 95% confidence interval were obtained, presented in Figure 1. It was verified that the commercial hybrid Agroeste 1551 VT PRO 2 differed from the other genotypes, based on the confidence intervals overlap, in relation to their predicted genotypic values. It was also verified that the top cross Criolão x Planalto, which presented the best ranking among the other top cross hybrids by their genotype value (Table 5), had inferior performance only than the commercial hybrid Agroeste 1551 VT PRO 2, being a promising genotype, although revealing no differences of genotypic effects from the nine best genotypes by the ordering. Similarly, when considering the confidence intervals overlapping of genotypic values, we observed that several genotypes are statistically equal at 95% of confidence level, being unable to prove differences between them, as reported by Resende (2006).

Figure 1:Predicted genotypic values (
The coefficient of genetic variation presents a major contribution to the total phenotypic variance for all evaluated traits. The individual heritabilities in the broad sense, and based on genotypes means, contribute to greater genetic gains regarding the grain yield trait.
The top cross hybrids Cateto Branco x Planalto, Amarelão x Planalto and the population Cateto Branco are the best classified among the ten best genotypes, simultaneously, for the traits: leaf angle, number of ramifications of the tassel, spike insertion height and plant height, and leaf angle, spike insertion height and plant height (Amarelão x Planalto and Cateto Branco).
The top cross hybrids Criolão x Planalto, Branco 8 Carreiras x Planalto, Caiano Rajado x Planalto, Amarelão x Planalto, and Branco Roxo Índio x Planalto stand out for presenting high genotypic value of individual BLUP mean components among the ten best genotypes for grain yield, and combining together three or more traits of interest, being, for purpose of selection, the most indicated.
Conflicts of interest
The authors declare no conflict of interest.
Acknowledgments
The authors thank Coordenação de Aperfeiçoamento de Pessoal de Nível Superior (CAPES) for project financing and the granting of the first author’s doctoral fellowship. V.Q de Souza received a 2A productivity scholarship from CNPq.
About the Authors
Corresponding Author
M. Nardino
Departamento de Matemática e EstatÃsti, Universidade Federal de Pelotas, Capão do Leão, , Brazil
- Email:
- ppe.clc.ufpel@gmail.com
References
- Araújo PM and Nass LL (2002). Characterization and evaluation of maize landraces. Sci. Agr. 59: 589-593 10.1590/S0103-90162002000300027.
- Arnhold E, Mora F, Pacheco CAP and Carvalho HWLD (2012). Prediction of genotypic values of maize for the agricultural frontier region in northeastern Maranhão, Brazil. C. Breed. Ap. Biotec. 12: 151-155 https://doi.org/10.1590/S1984-70332012000200009.
- Bastos IT, Barbosa MHP, De Resende MDV, Peternelli LA, et al. (2007). Evaluation of genotype versus environment interaction in sugarcane using mixed models. Pesq. Agrop. Tropl. 37: 195-203.
- Batista CM, Freitas MLM, De Moraes MA, Zanatto ACS, et al. (2012). Estimates of genetic parameters and variability in provenances and progeny of Handroanthus vellosoi. Pesq. Flor. Bras. 32: 269-276 https://doi.org/10.4336//2012. pfb.32.71.269.
- Borges V, Ferreira PV, Soares L, Santos GM, et al. (2010). Sweet potato clone selection by REML/BLUP procedure. Ac. Sci. Agr. 32: 643-64910.4025/actasciagron.v32i4.4837.
- Camargo FF, Costa RD, Resende MD, Roa RAR, et al. (2010). Genetic variability for morphometric characteristics in brazilian nut parent trees from northern Mato Grosso, Amazon rain forest. Ac. Amaz. 40: 705-710 https://doi. org/10.1590/S0044-59672010000400010.
- Carias CMDOM, Tomaz MA, Ferrão MAG, da Fonseca AFA, et al. (2014). Grain yield of coffee conilon different maturity groups by REML / BLUP. Semina: C. Agr. 35: 707-718 10.5433/1679-0359.2014v35n2p707.
- Carpentieri-Pípolo V, Souza A, Silva DA, Barreto TP, et al. (2010). Evaluation of maize landrace cultivars under a low-tech system. Acta Sci. Agr. 32: 229-233 10.4025/actasciagron.v32i2.430.
- Duvick DN and Cassman KG (1999). Post-green revolution trends in yield potential of temperate maize in the North-Central United States. Crop Sci. 39: 1622-1630. http://10.2135/cropsci1999.3961622x
- Freitas ILJ, Amaral AT, Junior, Viana AP, Pena GF, et al. (2013). Genetic gain evaluated with selection indices and with REML/Blup in popcorn. Braz. J. Agric. Res. 48: 1464-1471 10.1590/S0100-204X2013001100007.
- Maia MCC, Resende MDV, Paiva JR, Cavalcanti JJV, et al. (2009). Simultaneous selection for genotypic production, adaptability, and stability in cashew clones by mixed models. Pesqui. Agropecu. Trop. 39: 43-50.
- Môro GV and Fritsche-Neto R (2015). Importância e usos do milho no Brasil. In: Milho: do plantio a colheita (Borém A, Galvão JCC and Pimentel MA, eds.). Viçosa, MG.
- Paterniani E, Nass LL and Santos MX (2000). O valor dos recursos genéticos de milho para o Brasil: uma abordagem histórica da utilização do germoplasma. In: Uma história brasileira do milho: o valor dos recursos genéticos (Udry CW and Duarte W, eds.). Brasília.
- Pimentel AJB, Guimarães JFR, Souza MA, Resende MDV, et al. (2014). Estimation of genetic parameters and prediction of additive genetic value for wheat by mixed models. Braz. J. Agric. Res. 49: 882-890 10.1590/S0100-204X2014001100007.
- Pimentel-Gomes F (2009). Curso de Estatística Experimental. 15th edn. Ed. Fealq, Piracicaba.
- Ramalho MAP, Abreu AFB, Santos JB and Nunes JAR (2012). Aplicações da genética quantitativa no melhoramento de plantas autógamas. Editora UFLA, Lavras.
- Resende MDV (2002). Genética biométrica e estatística no melhoramento de plantas perenes. Brasília: Embrapa Informação Tecnológica.
- Resende MDV (2006). O Software Selegen - Reml/Blup. Embrapa, Campo Grande.
- Resende MDV (2007a). Selegen-Reml/Blup: sistema estatístico e seleção genética computadorizada via modelos lineares mistos. Embrapa Florestas, Colombo.
- Resende MDV (2007b). Matemática e estatística na análise de experimentos e no melhoramento genético. Embrapa Florestas, Colombo.
- Resende MDV and Duarte JB (2007). Precisão e controle de qualidade em experimentos de avaliação de cultivares. Pesq. Agropec. Trop. 37: 182-194.
- Rosado AM, Rosado TB, Alves AA, Laviola BG, et al. (2012). Simultaneous selection of eucalyptus clones based on yield, stability and adaptability. Braz. J. Agric. Res. 47: 966-973 10.1590/S0100-204X2012000700013.
- Sangoi L, Guidolin AF, Coimbra JLM and Silva PRFD (2006). Response of maize hybrids grown at different eras to plant population and tassel removal. Cienc. Rur. 36: 1367-1373 https://doi.org/10.1590/S0103-84782006000500004.
- Santos GA, Resende MDV, Silva LD, Higa A, et al. (2013). Adaptability for Eucalyptus multi species hybrids in the State of Rio Grande do Sul. Rev. Arvore 37: 759-769 https://doi.org/10.1590/S0100-67622013000400019.
- Santos HG, Jacomine PKT, Anjos LHC, Oliveira VA, et al. (2006). Sistema brasileiro de classificação de solos. Embrapa Solos, Rio de Janeiro.
- Scapim CA, Carvalho CGP and Cruz CD (1995). A proposal of variation coefficient classification for corn growing. Braz. J. Agric. Res. 30: 683-68610.1590/1678-4499.458.
- Silveira DC, Bonetti LP, Tragnago JL and Monteiro V (2015). Agromorphologic characterization of mayze land varieties in the northwest region of Rio Grande do Sul. Ciência Tecnologia-Revista do Centro de Ciências da Saúde e Agrárias da UNICRUZ 1: 01-11.
- Vencovsky R (1987). Herança quantitativa. In: Melhoramento e produção do milho (Paterniani E and Viégas GP, eds.). Fundação Cargill, Campinas.
Keywords:
Download:
Full PDF- Share This