Diallel analysis for technological traits in upland cotton
Received: May 19, 2017
Accepted: August 11, 2017
Published: September 21, 2017
Genet.Mol.Res. 16(3): gmr16039727
DOI: 10.4238/gmr16039727
Abstract
Final cotton quality is of great importance, and it depends on intrinsic and extrinsic fiber characteristics. The objective of this study was to estimate general (GCA) and specific (SCA) combining abilities for technological fiber traits among six upland cotton genotypes and their fifteen hybrid combinations, as well as to determine the effective genetic effects in controlling the traits evaluated. In 2015, six cotton genotypes: FM 993, CNPA 04-2080, PSC 355, TAM B 139-17, IAC 26, and TAMCOT-CAMD-E and fifteen hybrid combinations were evaluated at the Experimental Station of Embrapa Algodão, located in Patos, PB, Brazil. The experimental design was a randomized block with three replications. Technological fiber traits evaluated were: length (mm); strength (gf/tex); fineness (Micronaire index); uniformity (%); short fiber index (%), and spinning index. The diallel analysis was carried out according to the methodology proposed by Griffing, using method II and model I. Significant differences were detected between the treatments and combining abilities (GCA and SCA), indicating the variability of the study material. There was a predominance of additive effects for the genetic control of all traits. TAM B 139-17 presented the best GCA estimates for all traits. The best combinations were: FM 993 x TAM B 139-17, CNPA 04-2080 x PSC 355, FM 993 x TAMCOTCAMD- E, PSC 355 x TAM B 139-17, and TAM B 139-17 x TAMCOTCAMD- E, by obtaining the best estimates of SCA, with one of the parents having favorable estimates for GCA
Introduction
Gossypium hirsutum L. var. latifolium is one of four species cultivated worldwide for production of fiber. It is exploited in large areas in tropical and subtropical regions, accounting for 90% of the world production, and has great social and economic importance in Brazil. World production is based on fibers from four species, the most important being G. hirsutum L., responsible for more than 90% of the fiber produced. The product harvested is called seed cotton, which is composed by the lint (fiber and seed). The fiber is used by the spinning industry and the seed in animal and human feed. In this species, the fiber length may range from medium to long (25.4 to 34.9 mm) (Fuzatto, 1999; Penna, 1999). World cotton trade has moved around US$12 billion annually, involving more than 350 million people in its production line. It is produced in all continents in more than 60 countries, five of them - China, India, the United States, Pakistan, and Brazil - are the main cotton fiber producers (FAO, 2016).
Cotton cultivation has great relevance for the Brazilian economy, mainly due to obtaining the textile fiber. In Brazil, the fifth largest producer, the production is concentrated in the Midwest region (Carvalho et al., 2015). The country stands out as the world’s third largest exporter of cotton. The largest producing States are Mato Grosso, Bahia, Goiás, Mato Grosso do Sul, and Minas Gerais (CONAB, 2017). Cotton breeding programs developed by Brazil have goals similar to those from other Latin American countries, such as improving yield, ginning income, and obtaining better quality fibers, with priority to achieve more yielding, early and with high fiber yield cultivars, in addition to finer and more strength and uniform fibers (Freire et al., 2008).
To meet these demands, breeders use genetic and statistical tools to gain success in breeding programs. One of the most used techniques is diallel analysis. Diallel crosses contribute to obtaining information that helps to select genotypes of interest to the farmer. Among the several existing methodologies, diallel analysis methodology proposed by Griffing (1956) allows estimating the general combining ability (GCA) and specific combining ability (SCA) (Cruz, 2006). Combining ability describes the genetic value of parents to generate superior hybrids. Sprague and Tatum (1942) used the term GCA to denote the average performance of a parent in their hybrid combinations and used the term SCA to define cases where certain combinations are relatively better or worse than expected based on GCA.
Zeng and Pettigrew (2015), studying the combining abilities and the heritability in F2 hybrid cotton for yield and technological fiber traits on different planting times, observed significant differences for GCA and not for SCA among the fiber traits, indicating a predominance of additive genetic effects. Kothari et al. (2016), studying the combining abilities in cotton genotypes for improving oil content, observed that both GCA and SCA showed significant differences for fiber traits, indicating additive and non-additive genetic control. Kumar et al. (2014), studying the genetic effects and combining abilities in upland cotton, observed predominance of genetic additive effects for all fiber traits.
The objective of this study was to estimate the GCA and SCA and to obtain information on the genetic control of technological fiber traits among six upland cotton genotypes and their hybrid combinations.
Materials and Methods
In 2015, six cotton genotypes: FM 993, CNPA 04-2080, PSC 355, TAM B 139-17, IAC 26, and TAMCOT-CAMD-E and fifteen hybrid combinations were evaluated at the Experimental Station of Embrapa Algodão, located in Patos - PB. The experimental area is characterized by the geographical position 7°0’40.55’’S and 37°16’14.80’’W, 243.28 m in altitude, with average rainfall recorded in 2015 of 495.7 mm (AESA, 2017). The trial was conducted under irrigation regime. Experimental plot consisted of two rows of 5 m in length, spacing 1.0 m between rows and 0.20 m between plants, with a useful area of 10 m2 and a population density of 50 plants/ row. The experimental design was a randomized block with three replications.
Seeding was done manually, leaving 25 plants in each row of 5.0 m, and the thinning was performed 30 days after sowing. Cultural practices were done according to the crop needs over the conduction of the experiment. Technological fiber traits were evaluated at the Laboratory of Fiber and Yarn Technology of the Embrapa Algodão, in Campina Grande - PB, using the HVI device (Uster HVI 1000) taking up 20 bolls/plot as a standard sample. The analyzed traits were: fiber length - LEN (mm); fiber strength - ST (gf/tex); fineness - FIN (Micronaire index); fiber uniformity - UNF (%); short fiber index - SFI (%), and spinning index - SPI.
Statistical genetic analyses for the data obtained in the trial were made using the GENES software version 2014.6.1 (Cruz, 2013). For analysis of variance, the F-test at 1 and 5% probability was used. Means between treatments were clustered using the Scott and Knott (1974) test at 5% probability. The diallel analysis was performed according to the methodology proposed by Griffing (1956), using method II and model I, which estimates the GCA  effects from each parent and SCA
  effects. The model was considered fixed for the genotype effects. Statistical genetic model is given by Equation 1:
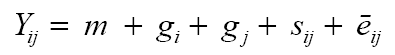 (equation 1)
where Yij: mean value of the hybrid combination (i ≠ j) or of the parent (i = j); m: overall mean; gi, gj: GCA effect of the i-th and j-th parent, respectively; sij: SCA effect for the crosses among the parents of i and j order;  :mean experimental error.
Results and Discussion
The summary of analysis of variance is shown in Table 1. There is variability among the evaluated materials, due to the statistical significance for the genotypes regarding all fiber traits evaluated. Experimental precision indicated by the coefficient of variation (CV) ranged from 1.14% (UNF) to 6.73% (SPI), which is classified as adequate. Similar results for CV were found by Hoogerheide et al. (2007) and Carvalho et al. (2015).
| SV | d.f. | LEN | ST | FIN | UNF | SFI | SPI |
| Genotypes | 20 | 11.51** | 17.57** | 0.47** | 3.46** | 0.50** | 399,642.63** |
| GCa | 5 | 40.39** | 51.24** | 1.46** | 10.72** | 1.60** | 1,425,840.92** |
| SCa | 15 | 1.88** | 6.35** | 0.14* | 1.05ns | 0.13ns | 57,576.53ns |
| Error | 40 | 0.63 | 2.12 | 0.07 | 0.96 | 0.17 | 34,683.77 |
| ΦGCa | 1.65 | 2.04 | 0.05 | 0.40 | 0.05 | 57,964.88 | |
| ΦSCa | 0.41 | 1.41 | 0.02 | 0.02 | -0.01 | 7,630.92 | |
| Mean | 28.71 | 32.62 | 5.28 | 85.31 | 6.32 | 2,764.06 | |
| CV (%) | 2.77 | 4.46 | 5.11 | 1.14 | 6.65 | 6.73 |
**,*Significant at 1 and 5% probability by the F-test. SV: sources of variation; ΦGCA - quadratic component associated with GCA; ΦSCA - quadratic component associated with SCA. CV - coefficient of variation; d.f. - degrees of freedom; LEN - fiber length; ST - fiber strength; FIN - fineness (Micronaire index); UNF - uniformity; SFI - short fiber index; SPI - spinning index.
Table 1: Analysis of variance for genotypes and GCA and SCA of the traits evaluated by Griffing model (1956), involving parents and F1 hybrids.
In Table 2, the classification of means from the Scott and Knott (1974) test at 5% is presented. The traits LEN, ST, FIN, UNF, SFI, and SPI formed groups, confirming the genotype variability for these traits. For fiber length, FM 993 x TAM B 139-17 presented the highest value (32.70 mm). Regarding strength, the highlight was the combination CNPA 04- 2080 x PSC 355 (36.15 gf/tex). For the fineness trait, the values obtained by the genotypes ranged from 5.86 to 4.33 μg/in, being considered values higher than the required by textile industry. The TAM B 139-17 genotype showed the lowest value (4.33 μg/in). Regarding the uniformity, all genotypes and combinations presented values higher than 83%, highlighting the combination PSC 355 x TAM B 139-17 with values of 87.96%. For short fiber index, the combination CNPA 04-2080 x PSC 355 showed the lowest value (5.77%). Regarding spinning, the highest value was observed for the TAM B 139-17 genotype (3447.00). According to Freire et al. (2015), the main cotton breeding programs in Brazil aim more yielding, early and high fiber yield cultivars (greater than 40%) in addition to fine (Micronaire index between 3.7 and 4.2), more strength (above 28 gf/tex) and uniform (above 84%) fibers. According to Vidal Neto and Freire (2013), the importance of the fiber traits can follow the following order: fineness, length, strength, elongation, short fiber index, spinning and color degree; however, each type of cotton has its market.
| Parents | LEN | ST | FIN | UNF | SFI | SPI |
| FM 993 | 27.53c | 33.91a | 5.55a | 84.65b | 6.72a | 2656.00b |
| CNPA 04-2080 | 27.40c | 30.55b | 5.20a | 85.20b | 6.25b | 2575.00b |
| PSC 355 | 27.53c | 33.66a | 5.33a | 85.46a | 6.00b | 2769.33b |
| TAM B 139-17 | 32.26a | 35.73a | 4.33c | 86.33b | 5.86b | 3447.00a |
| IAC 26 | 27.06c | 34.40a | 5.36a | 83.76b | 6.43a | 2605.66b |
| TAMCOT-CAMD-E | 26.73c | 28.03b | 4.96b | 83.70b | 7.30a | 2294.66c |
| FM 993 x CNPA 04-2080 | 28.20c | 30.86b | 5.50a | 85.06b | 6.66a | 2556.33b |
| FM 993 x PSC 355 | 27.87c | 31.35b | 5.58a | 85.59a | 6.22b | 2616.65b |
| FM 993 x TAM B 139-17 | 32.70a | 35.20a | 4.76b | 86.23a | 5.90b | 3337.00a |
| FM 993 x IAC 26 | 26.80c | 30.84b | 5.83a | 84.27b | 6.21b | 2337.00c |
| FM 993 x TAMCOT-CAMD-E | 28.22c | 30.15b | 4.93b | 84.34b | 6.97a | 2582.15b |
| CNPA 04-2080 x PSC 355 | 27.52c | 36.15a | 5.78a | 85.89a | 5.77b | 2803.15b |
| CNPA 04-2080 x TAM B 139-17 | 30.87b | 34.13b | 5.01b | 86.24a | 6.22b | 3121.33a |
| CNPA 04-2080 x IAC 26 | 28.13c | 32.16a | 5.53a | 85.06b | 6.46a | 2624.00b |
| CNPA 04-2080 x TAMCOT-CAMD-E | 28.10c | 29.40a | 5.43a | 84.33b | 6.76a | 2411.66c |
| PSC 355 x TAM B 139-17 | 31.56b | 35.06b | 4.90b | 87.96a | 5.90b | 3417.33a |
| PSC 355 x IAC 26 | 27.53c | 32.96a | 5.86a | 86.20a | 5.80b | 2693.66b |
| PSC 355 x TAMCOT-CAMD-E | 27.50c | 30.00a | 5.40a | 84.85b | 6.35b | 2474.66c |
| TAM B 139-17 x IAC 26 | 31.13b | 35.76a | 5.30a | 85.86a | 6.20b | 3130.66a |
| TAM B 139-17 x TAMCOT-CAMD-E | 31.16b | 34.33a | 4.76b | 86.50a | 6.13b | 3227.00a |
| IAC 26 x TAMCOT-CAMD-E | 27.10c | 30.50b | 5.53a | 84.03b | 6.66a | 2365.00c |
Means followed by same letter do not differ at 5% probability by the Scott-Knott test. LEN - fiber length; ST - fiber strength; FIN - fineness (Micronaire index); UNF - uniformity; SFI - short fiber index; SPI - spinning index.
Table 2: Means of parents and their hybrid combinations for the traits LEN, ST, FIN, UNF, SFI, and SPI (Patos, PB, 2015).
Combining abilities
In Table 1, the diallel analysis for the traits under study is shown. All traits were significant for GCA, indicating that at least one parent was superior to others concerning the mean performance in their hybrid combinations. As for SCA, the traits UNF, SFI, and SPI were not significant. The quadratic components shown in Table 1 referring to GCA and SCA indicate a predominance of GCA effects, showing a greater importance of additive effects controlling the traits under study. For LEN, these results are supported by Smith et al. (2010); Karamedir and Gençer (2010); Hinze et al. (2011), and Zhang et al. (2016), who also found a predominance of additive effects for length. For ST, Hinze et al. (2011), Zeng et al. (2011), Patel et al. (2014), Ng et al. (2014), Kothari et al. (2016), and Zhang et al. (2016) observed similar gene effects in their results. Regarding FIN, Karamedir and Gençer (2010); Zeng et al. (2011); Hinze et al. (2011), and Zhang et al. (2016) found similar results. The results for UNF are supported by Aguiar et al. (2007) and Hinze et al. (2011). For SFI, similar results were obtained by Aguiar et al. (2007) and Zeng et al. (2011). Regarding SPI, results are supported by Aguiar et al. (2007), which observed the predominance of additive effects in the control of fiber spinning in upland cotton genotypes.
GCA effects 
In Table 3, the estimates of GCA effects of the parents under study are shown. The parent TAM B 139-17 presented the best positive estimates followed by high means for LEN (2.62), ST (2.19), UNF (1.03), SPI (472.36) and the best negative estimates for FIN (-0.44) and SFI (-0.27), meaning that this parent can contribute genetically to improving these traits.
| Parents | LEN | ST | FIN | UNF | SFI | SPI |
| FM 993 | -0.26 | -0.26 | 0.09 | -0.29 | 0.14 | -75.91* |
| CNPA 04-2080 | -0.42** | -0.57* | 0.08 | -0.02 | 0.01 | -85.24* |
| PSC 355 | -0.49** | 0.55* | 0.15** | 0.53** | -0.27** | 24.46 |
| TAM B 139-17 | 2.62** | 2.19** | -0.44** | 1.03** | -0.27** | 472.36** |
| IAC 26 | -0.76** | 0.33 | 0.22** | -0.52** | -0.00 | -123.34** |
| TAMCOT-CAMD-E | -0.67** | -2.24** | -0.12* | -0.71** | 0.40** | -212.32** |
| SD (gi) | 0.14 | 0.27 | 0.05 | 0.18 | 0.07 | 34.70 |
| SD (gi - gj) | 0.22 | 0.42 | 0.07 | 0.28 | 0.12 | 53.76 |
**,*Significant at 1 and 5% probability by the t-test. SD (gi): standard deviation; SD (gi - gj): standard deviation of the difference of two parent effects; LEN - fiber length; ST - fiber strength; FIN - fineness (Micronaire index); UNF - uniformity; SFI - short fiber index; SPI - spinning index.
Table 3: Estimates of general combining ability effects among six cotton genotypes for technological fiber traits.
SCA effects
Table 4 shows estimates of the SCA effects . Considering the LEN, the hybrid from FM 993 x TAM B 139-17 showed the highest positive estimate, with one of the parents having a positive estimate of GCA . For ST, CNPA 04-2080 x PSC 355 showed the highest estimates accompanied by parents with positive estimates of GCA . About FIN, the FM 993 x TAMCOT-CAMD-E hybrid showed the lowest estimates, with one of the parents with negative estimates For UNF, PSC 355 x TAM B 139-17 showed the high estimates, followed by parents with positive estimates of . The TAM B 139-17 x TAMCOTCAMD- E hybrid presented the best negative and positive estimates, respectively, of for SFI and SPI, accompanied by parents with favorable estimates of .
| Parents | LEN | ST | FIN | UNF | SFI | SPI |
| FM 993 | -0.65 | 1.82** | 0.08 | -0.06 | 0.11 | 43.75 |
| CNPA 04-2080 | -0.47 | -0.93 | -0.25* | -0.06 | -0.10 | -18.57 |
| PSC 355 | -0.19 | -0.08 | -0.25* | -0.90* | 0.23 | -43.65 |
| TAM B 139-17 | -1,69** | -1.28* | -0.05 | -1.05* | 0.08 | -261.78** |
| IAC 26 | -0.10 | 1.11 | -0.37** | -0.49 | 0.12 | 88.29 |
| TAMCOT-CAMD-E | -0.62 | -0.10 | -0.07 | -0.18 | 0.17 | -44.74 |
| FM 993 x CNPA 04-2080 | -0.65 | -0.92 | 0.03 | 0.07 | 0.18 | -46.57 |
| FM 993 x PSC 355 | -0.08 | -1.56* | 0.05 | 0.04 | 0.03 | -95.95 |
| FM 993 x TAM B 139-17 | 1.62** | 0.64 | -0.16 | 0.18 | -0.29 | 176.48 |
| FM 993 x IAC 26 | -0.87* | -1.84* | 0.23 | -0.21 | -0.24 | -227.80* |
| FM 993 x TAMCOT-CAMD-E | 0.45 | 0.03 | -0.32* | 0.04 | 0.10 | 106.33 |
| CNPA 04-2080 x PSC 355 | -0.27 | 3.53** | 0.26 | 0.07 | -0.28 | 99.87 |
| CNPA 04-2080 x TAM B 139-17 | -0.04 | -0.11 | 0.08 | -0.08 | 0.15 | -29.84 |
| CNPA 04-2080 x IAC 26 | 0.60 | -0.21 | -0.06 | 0.30 | 0.13 | 68.52 |
| CNPA 04-2080 x TAMCOT-CAMD-E | 0.48 | -0.41 | 0.18 | -0.23 | 0.02 | -54.82 |
| PSC 355 x TAM B 139-17 | 0.72 | -0.31 | -0.09 | 1.08* | 0.12 | 156.44 |
| PSC 355 x IAC 26 | 0.07 | -0.55 | 0.20 | 0.88 | -0.23 | 28.48 |
| PSC 355 x TAMCOT-CAMD-E | -0.04 | -0.94 | 0.08 | -0.27 | -0.09 | -101.53 |
| TAM B 139-17 x IAC 26 | 0.56 | 0.61 | 0.23 | 0.04 | 0.15 | 17.58 |
| TAM B 139-17 x TAMCOT-CAMD-E | 0.51 | 1.75* | 0.05 | 0.86 | -0.31 | 202.90* |
| IAC 26 x TAMCOT-CAMD-E | -0.16 | -0.21 | 0.14 | -0.03 | -0.05 | -63.38 |
| SD(Sii) | 0.33 | 0.61 | 0.11 | 0.41 | 0.17 | 78.69 |
| SD(Sij) | 0.40 | 0.74 | 0.13 | 0.52 | 0.21 | 95.30 |
| SD(Sii - Sjj) | 0.45 | 0.84 | 0.15 | 0.56 | 0.24 | 107.52 |
| SD(Sij- Sik) | 0.60 | 1.11 | 0.20 | 0.74 | 0.32 | 142.23 |
| SD(Sij - Skl) | 0.56 | 1.03 | 0.19 | 0.69 | 0.29 | 131.68 |
**,*Significant at 1 and 5% probability by the t-test. LEN - fiber length; ST - fiber strength; FIN - fineness (Micronaire index); UNF - uniformity; SFI - short fiber index; SPI - spinning index.
Table 4: Estimates of specific combining ability effects among six upland cotton genotypes for technological fiber traits.
Conclusion
There was significant genetic variability for all traits studied, fundamental in forming populations that maximize genetic gains. Additive effects were predominant for all traits studied. The TAM B 139-17 genotype showed the best GCA estimates for all traits, accompanied by high means, being indicated for breeding programs aiming at improving these characteristics. The best hybrid combinations were: FM 993 x TAM B 139-17, CNPA 04-2080 x PSC 355, FM 993 x TAMCOT-CAMD-E, PSC 355 x TAM B 139-17, and TAM B 139-17 x TAMCOT-CAMD-E, since they have high means associated with positive and high estimates of SCA, with at least one of their parents with high GCA.
Acknowledgments
The authors thank Empresa Brasileira de Pesquisa Agropecuária - Embrapa Algodão.
About the Authors
Corresponding Author
P.E. Teodoro
Departamento de Agronomia, Universidade Federal do Mato Grosso do Sul, Chapadão do Sul, MS, Brasil
- Email:
- proiupc_bog@unal.edu.co
References
- Agência Executiva de Gestão das Águas do Estado da Paraíba (AESA) (2017). [http://www.aesa.pb.gov.br/]. Accessed March 24, 2017. Chuvas acumuladas no ano 2015, [http://site2.aesa.pb.gov.br/aesa/monitoramentoPluviometria.do]. Accessed March 24, 2017.
- Aguiar PA, Penna JCV, Freire EC and Melo LC (2007). Diallel analysis of upland cotton cultivars. Aust. J. Crop Sci. 7:353-359.
- Carvalho LP, Salgado CC, Farias FJC and Carneiro VQ (2015). Estabilidade e adaptabilidade de genótipos de algodão de fibra colorida quanto aos caracteres de fibra. Cienc. Rural 45: 598-605. https://doi.org/10.1590/0103-8478cr2013023
- Companhia Nacional de Abastecimento (CONAB) (2017). [http://www.conab.gov.br/]. Accessed March 24, 2017. Acompanhamento da Safra Brasileira de Grãos 2016/2017, Quarto Levantamento, Janeiro de 2017, [http://www.conab.gov.br/OlalaCMS/uploads/arquivos/17_01_11_11_30_39_boletim_graos_janeiro_2017.pdf]. Accessed March 24, 2017.
- Cruz CD (2006). Programa GENES: biometria. UFV, Viçosa.
- Cruz CD (2013). GENES - a software package for analysis in experimental statistic and quantitative genetics. Acta Sci. Agron. 35: 271-276. https://doi.org/10.4025/actasciagron.v35i3.21251
- Food and Agriculture Organization of the United Nations (FAO) (2016). [http://www.fao.org/home/en/]. Accessed August 31, 2016). Statistics Divison, [http://faostat3.fao.org/browse/rankings/countries_by_commodity/E]. Accessed August 31, 2016.
- Freire EC, Morello CL, Farias FJC, Filho JLS, et al. (2008). Objetivos e métodos usados nos programas de melhoramento do algodão. In: O agronegócio do algodão no Brasil (Beltrão NEM and Azevedo DMP, eds.). 2nd edn. Embrapa Informações Tecnológicas, Distrito Federal, 299-324.
- Freire EC, Morello CL, Farias FJC, Pedrosa MB, et al. (2015). Melhoramento do algodoeiro: cultivares convencionais e transgênicas para o cerrado. In: Algodão no cerrado do Brasil (Freire EC, ed.). 3rd edn. Associação Brasileira dos Produtores de Algodão - ABRAPA, Brasília, 151-201.
- Fuzatto MG (1999). Melhoramento genético do algodoeiro. In: Cultura do algodoeiro (Cia E, Freire EC and Santos WJ, eds.). Potafos, Piracicaba, 15-34.
- Griffing B (1956). Concept of general and specific ability in relation to diallel crossing systems. Aust. J. Biol. Sci. 9: 462-493. https://doi.org/10.1071/BI9560463
- Hinze LL, Campbell BT and Kohel RJ (2011). Performance and combining ability in cotton (Gossypium hirsutum L.) populations with diverse parents. Euphytica 181: 115-125. https://doi.org/10.1007/s10681-011-0442-x
- Hoogerheide ESS, Vencovsky R, Farias FJC, Freire EC, et al. (2007). Correlações e análise de trilha de caracteres tecnológicos e a produtividade de fibra de algodão. Pesqui. Agropecu. Bras. 42: 1401-1405. https://doi.org/10.1590/ S0100-204X2007001000005
- Karamedir E and Gençer O (2010). Combining ability and heterosis for yield and fiber quality properties in cotton (G.hirsutum L.) obtained by half mating design. Not. Bot. Horti Agrobot. Cluj-Napoca 38: 222-227.
- Kothari N, Campbell TB, Dever JK and Hinze LL (2016). Combining ability and performance of cotton germplasm with diverse seed oil content. Crop Sci. 56: 19-29. https://doi.org/10.2135/cropsci2015.03.0166
- Kumar K, Ashokkumar K and Ravikesavan R (2014). Genetic effects of combining ability studies for yield and fiber quality traits in diallel crosses of upland cotton (Gossypium hirsutum L.). Afr. J. Biotechnol. 13: 119-126. https://doi. org/10.5897/AJB2013.13079
- Ng E-H, Smith CW, Hequet E, Hague S, et al. (2014). Diallel analysis of fiber quality traits with an emphasis on elongation in upland cotton. Crop Sci. 54: 514-519. https://doi.org/10.2135/cropsci2013.06.0414
- Patel DH, Patel DU and Kumar V (2014). Heterosis and combining ability analysis in tetraploid cotton (G. hirsutum L. and G. barbadense L.). Elet. J. Plant Breed. 5: 408-414.
- Penna JCV (1999). Melhoramento do Algodão. In: Melhoramento de espécies cultivadas (Borém A, ed.). UFV, Viçosa, 15-50.
- Scott AJ and Knott M (1974). A cluster analysis method for grouping means in the analysis of variance. Biometrics 30:507-512. https://doi.org/10.2307/2529204
- Smith CW, Braden CA and Hequet EF (2010). Genetic analysis of fiber length uniformity in upland cotton. Crop Sci. 50:567-573. https://doi.org/10.2135/cropsci2009.04.0202
- Sprague GF and Tatum LA (1942). General vs. specific combining ability in single crosses of corn. Agron. J. 34: 923-932. https://doi.org/10.2134/agronj1942.00021962003400100008x
- Vidal Neto FC and Freire EC (2013). Melhoramento genético do algodoeiro. In: Melhoramento genético de plantas no nordeste (Vidal Neto FC and Cavalcanti JJV, eds.). Embrapa, Brasília, 49-83.
- Zeng L and Pettigrew WT (2015). Combining ability, heritability, and genotypic correlations for lint yield and fiber quality of upland cotton in delayed planting. Field Crops Res. 171: 176-183. https://doi.org/10.1016/j.fcr.2014.10.004
- Zeng L, Meredith JRW and Boykin DL (2011). Germplasm potential for continuing improvement of fiber quality in upland cotton: combining ability for lint yield and fiber quality. Crop Sci. 51: 60-68. https://doi.org/10.2135/ cropsci2010.07.0413
- Zhang J, Wu M, Yu J, Li X, et al. (2016). Breeding potential of introgression lines developed from interspecific crossing between upland cotton (Gossypium hirsutum) and Gossypium barbadense: heterosis, combining ability and genetic effects. PLoS One 11: e0143646. https://doi.org/10.1371/journal.pone.0143646
Keywords:
Download:
Full PDF- Share This