Determination of the number of harvests to select elite sugarcane genotypes in NE Brazil
Received: December 14, 2017
Accepted: January 08, 2018
Published: January 20, 2018
Genet.Mol.Res. 17(1): gmr16039869
DOI: 10.4238/gmr16039869
Abstract
Sixty-eight sugarcane genotypes were evaluated to determine the number of harvests required to select new genotypes in the sugarcane belt in the state of Pernambuco, northeast Brazil. Using a random block design, the following parameters were evaluated: (i) polarizable sugars (POL) per hectare, in metric tons (TPH); (ii) culm productivity per hectare (TCH); (iii) fiber content (FIB); (iv) adjusted percent POL (PCC); (v) soluble solids (BRIX); (vi) total recoverable sugars (ATR); and (viii) metric tons of ATR per hectare (ATR t.ha-1). A variance analysis and genetic parameter estimation were carried out. Means were analyzed using the Scott and Knott test. The repeatability coefficient and the number of harvests were determined using analysis of variance, principal component analysis, and structured data analyses. The best cultivars were SP79-1011, RB952692, RB952675, RB813804, SP78-4764, RB952522, RB952511, RB953265, RB952754, RB952875, SP80-1816, RB763710, and RB892575. Two evaluations are enough to select elite genotypes in the early experimental stages, reducing the time-to-market of these cultivars by three years under the edaphic and climatic conditions in the sugarcane belt evaluated
Introduction
Sugarcane holds considerable importance in Brazil’s economy, accounting for approximately 2% of the country’s gross domestic product (Biosev, 2013). Recent biotechnological breakthroughs have afforded to explore the biological potential of sugarcane more fully. For example, current research has shown that the plant species may be used to produce biodiesel, in a process based on a genetically modified yeast in a partnership between the company Amyris and the São Martinho Group (Única, 2013). Also, Coelho et al. (2001) described a microbiological process to produce a sugarcane biopolymer with interesting healing properties both for domestic animals and for humans with skin lesions or submitted to surgery. However, sugar and ethanol remain the core sugarcane products today due to the best return on interest they afford.
As with any industrial process, quality of sugarcane raw material is essential in the generation of energy as well as the production of sugar, ethanol, and any other item based on this plant species. In this sense, the quality of sugarcane cultivars is the starting point in estimating how successful an enterprise will be, and is the most important and least expensive technological variable from the producer’s standpoint (Barbosa and Silveira, 2012).
Several factors determine sugarcane productivity when manufacturing sugar, ethanol, and other sugarcane-based products. These parameters include the management, planning, and implementation of up-to-date agricultural technologies, in addition to using agricultural inputs reasonably. In this sense, more productive and resistant cultivars with favorable traits developed by genetic improvement programs are central to obtain higher yields at lower costs and better quality. For Silva (2008), the ideal sugarcane cultivar is the one that affords high productivity even under harsh environmental conditions.
More specifically in Brazil, the state of Pernambuco (PE) stands out as the second largest sugarcane producer in the country’s northeast region, with approximately 14.90 million metric tons produced to meet the demands of the sugar and energy industries (CONAB, 2013). The main hurdle to increasing productivity is the interaction genotype × environment, which is influenced by specific soil characteristics such as altitude, for instance, and more particularly so by irregular rainfall patterns marked by long droughts.
In their pioneering study, Koffler et al. (1986) characterized the sugarcane belt in PE. The authors systematically gathered a whole set of relevant environmental information with a view to widening the horizons of future genetic improvement research on sugarcane. With that in mind, they split the sugarcane belt in PE into five micro-regions, namely North Woodlands (NW), South Woodlands (SW), Mid Belt (MB), North Coast (NC), and South Coast (SC), and described the geology, geomorphology, climate, hydrology, natural plant cover, soils, and ecological zoning of each.
Subsequently, edaphic and climatic aspects of these micro-regions were investigated considering the suitability to grow sugarcane. It was found that the occurrence of distinctive environments is behind the specific limitations affecting the interaction of soil and climate factors with sugarcane productivity. In genetic improvement terms this means that the agro-industrial performance of a given sugarcane cultivar in a region may not match that in another, and that the environment may influence the expression of desired traits in plants. Interestingly, climate characteristics also vary across harvest seasons, and may shorten the lifespan of ratoons. As a result, sugarcane plantations require renewing at comparatively short intervals, increasing productivity losses.
For this reason, the samples used in cultivar assays at the final stages of an experiment are based on the means of three to four harvests (Koffler et al., 1986). These experiments compare the performance of new clones with that of cultivars more widely grown (Ferreira et al., 2005), identifying high-productivity and high-longevity cultivars in ratoons, as carried out by Melo et al. (2009). The authors assessed the agronomic performance of sugarcane genotypes in SC (PE) using both univariate and multivariate analysis of variance (ANOVA) of experiments and relevant genetic parameters, managing to characterize genotypes that performed better both in the field and in industrial processes. However, these analyses do not suffice to identify the genotypes with high longevity potential in ratoons.
The objective of genotype selection is to increase a genotype’s agroindustry performance throughout its lifetime, and to make sure that the good performance of an individual plant in certain traits reflects the genetic potential of the cultivar as a whole (Cruz and Regazzi, 2001). More specifically in sugarcane, the expectation lies in more long-lived ratoons, that is, high productivity in the plant crop and the 1st, 2nd, and 3rd ratoon crops. In this context, a feasible alternative in the identification of more long-lived genotypes includes the use of the repeatability coefficient (r). The coefficient is useful to determine the number of harvests required to select the best genotypes, significantly reducing costs—since cultivar selection assays are costly and time-consuming. In addition,r also helps shorten the time-to-market of new cultivars from the 12 to 15 years on average required Currently, several methods are available to estimate r, such as ANOVA, principal component analysis (PCA) (Abeywardena, 1972) and structured data analysis (SA) (Mansour et al., 1981).
Ferreira et al. (2005) evaluated sugarcane genotypes grown in the production belts in the Brazilian states of São Paulo, Minas Gerais, and Goiás. Based on r, the authors discovered that three harvests are enough when selecting new genotypes with predictability degree above 80% of actual values. Santos et al. (2004) evaluated sugarcane genotypes in the state of Alagoas, Brazil, and concluded that the five harvests afford the selection of genotypes with predictability above 80% of actual values.
These studies are especially relevant in the context of sugarcane production in PE, Brazil, since no research covering the whole state’s sugarcane belt has been published. So, the objectives of the present study were to evaluate the agro-industrial performance of 68 sugarcane genotypes and to determine the number of harvests needed to select elite genotypes for commercial growth of the plant species in the sugarcane belt in PE, Brazil.
Materials and Methods
General description of the experiments
The experiments were conducted in plantations managed by the sugarcane mills participating in the Sugarcane Genetic Improvement Program, Federal Rural University of Pernambuco, Brazil, which is a affiliate of the Inter-university Network for the Development of the Sugar and Energy Sector (PMGCA/UFRPE/RIDESA): Usina São José, Usina Trapiche, Usina Central Olho d’Água, Usina Pumaty, and Usina Petribú. According to the classification system proposed by Koffler (1986), these mills are located in the sugarcane producer micro-regions North Woodlands (NW), South Woodlands (SW), Mid Belt (MB), North Coast (NC), and South Coast (SC), respectively, in the state of PE, Brazil.
A four-repeat randomized block design was used. A quadrat was defined as five 8-m lines 1 m apart with sugarcane grown using two culms placed next to each other, though the end of the first culm was next to the head of the second (Stolf, 1986). Soil pH adjustments and fertilization were carried out following the procedures used by the sugarcane mills cited above. The parameters evaluated were (i) polarizable sugars (POL) per hectare, in metric tons (TPH); (ii) culm productivity per hectare (TCH); (iii) fiber content (FIB); (iv) adjusted percent POL (PCC); (v) soluble solids (BRIX); (vi) total recoverable sugars (ATR); and (viii) metric tons of ATR per hectare (ATR t.ha-1).
Productivity per area unit (TCH) was estimated weighing all culms of a quadrat (kg) according to the formula:
TCH = total sugarcane weight (kg) × 10/quadrat used area (m2)
In turn, TPH was calculated using the formula: TCH × PCC/100
Also, ATR t.ha-1 was calculated using:
ATR t.ha-1 = TCH × ATR/1000.
BRIX was obtained using a refractometer and a homogenized sample of sugarcane juice obtained from 10 culms randomly collected in the quadrat. FIB, PCC, and ATR were calculated according to Fernandes (2003).
Genotypes evaluated and number of measurements
Four measurements were carried out (plant crop and the 1st, 2nd, and 3rd ratoon crops) in micro-region NC using the genotypes RB72454, RB763710, RB813804, RB952517, RB952522, RB952571, RB952675, RB952681, RB952692, RB952749, RB952754, RB952796, RB952826, and SP7910-11. In micro-region SC, measurements were carried out using the genotypes RB813804, RB952517, RB952522, RB952692, RB952754, RB952796, SP79-1011, RB952511, RB952904, RB953002, RB953133, RB953265, and SP78-4764. In NW the genotypes used were RB72454, RB763710, RB813804, RB952517, CP851491, RB942898, RB952675, RB952514, RB952609, RB952875, RB952884, RB953155, and SP79-1011. In SW the genotypes used were RB952692, RB952597, RB952517, RB952522, RB952571, RB952675, RB952681, RB952609, RB952749, RB952754, SP79-1011, RB952511, SP78-4764, and SP80-1816. In micro-region MB, three measurements were carried out (plant crop and 1st and 2nd ratoon crops) using the genotypes IAC851491, RB763710, RB813804, RB892575, CP851491, RB953214, RB953270, RB953245, SP79-1011, RB953265, RB943339, and RB953206.
Genetic and statistical analyses
Multivariate ANOVA was carried out using the statistical model proposed by Cruz (2006a): Yijk = µ + (b/c)jk + gi + ck + gcik + εijk
where Yijk = ith genotype evaluated in the jth block in the kth harvest
µ = overall mean value
(b/c)jk = effect of block j on the k harvest
gi = effect of treatment (genotype) i
ck = effect of harvest k
gcik = effect of the interaction genotype i and harvest k
εijk = random error associated with the ijk value
So, means (μ) and genotype (g) were considered effect variables, while block (b), harvest (c), interaction genotype-harvest (gc), and experimental error (ε) were considered the random variables.
The results of the multivariate ANOVA of experiments were obtained using the formula shown in Table 1.
| SV | df | E(MS) | F |
|---|---|---|---|
| Blocks/Harvest | (r-1)c |  |
|
| Harvests (H) | c – 1 |  |
MSH/MSB |
| Genotypes (G) | g – 1 |  |
MSG/MSGH |
| Interaction (G x H) | (c – 1)(g –1) |  |
MSGH/MSR |
| Residual | (g-1)(r – 1)c |  |
|
| ℓ = g/(g-1) |
Table 1. Expected mean squares to obtain the results of the multivariate ANOVA of experiments conducted in the sugarcane belt in PE, Brazil, considering the interaction genotype-harvest (sugarcane harvest cycles).
Means were grouped using the Scott and Knott (1974) test at 5% probability. The genetic parameters were estimated according to Cruz (2006a):
Genetic variance component: 
Genotype-harvest interaction variance component: 
Mean heritability: 
Genetic variance coefficient: 
b index: 
Hartley's F max was calculated before the multivariate ANOVA to evaluate the homogeneity of residuals and, according to Gomes (1990), all variables with a highest-to-lowest error variance ratio above 7 were adjusted for degrees of freedom of the mean residual error (n) and for the interaction between factors (n’) of the multivariate analysis, as described by Cochran (1974).
The two-way ANOVA, the PCA (Abeywardena, 1972), and the SA methods (Mansour, 1981) were used to estimate r.
Yij = μ + gi + aj + εij
where
Yij = Estimated r for the ith genotype in the jth harvest (time or space)
μ = Overall mean
gi = Effect of the ith genotype under the influence of last harvest (i = 1, 2, …p)
aj = Effect of the temporary harvest on the jth measurement (j = 1, 2, … η)
εij= experimental error based on the temporary effects on harvest in the jth measurement of the ith genotype. The ANOVA arrangement is shown in Table 2.
| FV | df | E(MS) | F |
|---|---|---|---|
| Genotypes | p-1 | MSG |  |
| Harvests (H) | c-1 | MSH | ____ |
| Residual | (p-1)(c-1) | MSR |  |
Table 2. Expected mean squares to obtain the results of estimated r values of experiments based on a two-way ANOVA in experiments conducted in the sugarcane belt in the state of Pernambuco, Brazil.
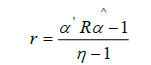
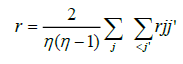
After the ANOVA, r was obtained using the formula:
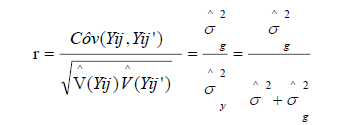
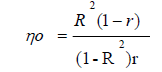
Therefore, the number of repeats required to predict the real value of individuals was obtained using the formula:
Next, r was estimated using PCA based on a phenotypic variance and multivariate matrix according to the statistical model introduced by Cruz and Regazzi (2001):
Yij = + gi + aj + εij
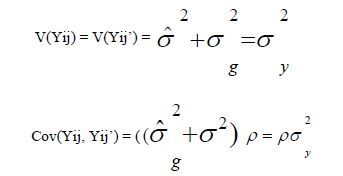
However, here the covariance matrix was obtained as:
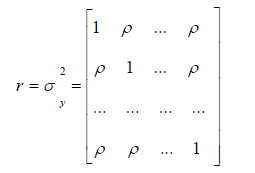
where
The main eigenvalue was obtained with:

The corresponding eigenvalue was obtained using the formula:

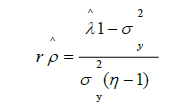
The r estimator was obtained using:
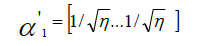
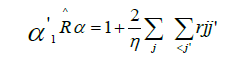
In turn, the SA used to estimate r was based on the parametric matrix of correlations between genotypes
in each analysis pair, and  was calculated using:
where
However, here
Therefore
This estimator of r is the arithmetic mean of the phenotypical correlations between genotypes considering each pair of measurements.
The determination coefficient was obtained using the formula:
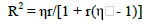
While the number of measurements required to predict the real individual value was:

All genetic and statistical analyses were carried out using the Genes (Cruz, 2006b) software.
Results and Discussion
The multivariate ANOVA of experiments revealed significant differences in TPH, TCH, FIB, BRIX, and ATR t. ha-1 across all genotypes grown in the five sugarcane micro-regions in PE, Brazil (Table 3).
| Mean squares | ||||||||
|---|---|---|---|---|---|---|---|---|
| Environments | Traits | Genotype | Harvest | G x H | Residual | Mean | CV(%) | H |
| TPH | 78.27** | 332.7** | 4.83** | 1.22 | 11.00 | 10.07 | 2.22 | |
| TCH | 2413.4** | 17883.5** | 152.5** | 27.27 | 74.71 | 6.98 | 2.62 | |
| FIB | 12.82** | 33.10** | 1.75** | 1.03 | 14.05 | 7.24 | 2.08 | |
| NC | PCC | 11.75** | 24.42** | 1.88* | 1.09 | 14.71 | 7.09 | 3.61 |
| BRIX | 14.64** | 75.66** | 2.08ns | 1.47 | 20.36 | 5.95 | 2.96 | |
| ATR | 1289.3** | 2639.6** | 224.0** | 126.87 | 150.87 | 7.46 | 3.70 | |
| ATR | 82.33** | 366.94** | 5.28** | 1.35 | 11.30 | 10.30 | 2.19 | |
| TPH | 72.00** | 280.59** | 5.58** | 1.69 | 9.57 | 13.58 | 6.76 | |
| TCH | 2710.58** | 12386.51** | 167.6** | 45.57 | 65.20 | 10.35 | 4.65 | |
| FIB | 3.44* | 75.40** | 1.46ns | 1.05 | 13.29 | 7.73 | 1.68 | |
| SC | PCC | 3.50ns | 150.81** | 2.19** | 1.21 | 14.75 | 7.47 | 3.08 |
| BRIX | 3.07* | 119.60** | 1.55* | 0.99 | 20.37 | 4.87 | 2.50 | |
| ATR | 431.77ns | 17540.72** | 262.0** | 150.03 | 150.74 | 8.12 | 3.33 | |
| ATR | 76.50** | 292.0** | 7.98** | 2.80 | 9.80 | 17.08 | 7.00 | |
| TPH | 128.48** | 409.70** | 5.21** | 1.16 | 11.61 | 9.30 | 2.12 | |
| TCH | 5986.09** | 10161.67** | 224.0** | 45.99 | 92.12 | 7.36 | 2.32 | |
| FIB | 30.92** | 10.25** | 2.63** | 1.27 | 13.86 | 8.15 | 2.95 | |
| NW | PCC | 10.96** | 111.07** | 1.70** | 0.90 | 12.45 | 7.62 | 2.54 |
| BRIX | 9.79** | 184.02** | 1.94** | 1.10 | 17.56 | 5.98 | 2.15 | |
| ATR | 1170.11** | 10697.89** | 167.14* | 97.86 | 127.76 | 7.74 | 2.42 | |
| ATR | 135.82** | 411.57** | 5.36** | 1.26 | 11.95 | 9.40 | 2.27 | |
| TPH | 38.41** | 648.77** | 6.56** | 0.90 | 9.10 | 10.47 | 5.77 | |
| TCH | 1640** | 35908.43** | 244.1** | 32.04 | 64.18 | 8.81 | 4.13 | |
| FIB | 25.00** | 90.14** | 1.88* | 1.27 | 14.86 | 7.60 | 3.93 | |
| SW | PCC | 3.94** | 17.04** | 1.13* | 0.72 | 14.25 | 5.97 | 4.00 |
| BRIX | 5.37** | 30.16** | 0.71* | 0.46 | 19.76 | 3.44 | 1.28 | |
| ATR | 452.11** | 1622.93** | 113.16* | 69.67 | 147.17 | 5.67 | 2.40 | |
| ATR | 41.80** | 694.0** | 7.04** | 0.95 | 9.42 | 10.38 | 5.79 | |
| TPH | 42.98** | 253.00** | 9.39** | 0.72 | 7.85 | 10.68 | 3.99 | |
| TCH | 1974.43** | 10565.58** | 403.2** | 44.23 | 61.83 | 10.75 | 8.09 | |
| FIB | 11.08* | 2.94ns | 4.63** | 0.99 | 14.50 | 6.88 | 1.54 | |
| MB | PCC | 5.40* | 68.99** | 2.26** | 0.55 | 12.54 | 5.93 | 1.96 |
| BRIX | 6.51* | 50.93** | 2.87** | 0.82 | 18.73 | 4.83 | 1.82 | |
| ATR | 525.73* | 7509.30** | 212.3** | 56.16 | 127.00 | 5.90 | 1.64 | |
| ATR | 43.20** | 254.10** | 9.38** | 0.73 | 7.96 | 10.68 | 4.41 | |
NC: North Coast, SC: South Coast, NW: North Woodlands, SW: South Woodlands, MB: Mid Belt.
G × H: Interaction genotype – harvest, CV (%): Coefficient of experimental variation, H: Hartley's F max test
Table 3. Multivariate ANOVA in experiments conducted in the sugarcane belt in the state of Pernambuco, Brazil, considering the parameters polarizable sugars (POL) per hectare, in metric tons (TPH); culm productivity per hectare (TCH); fiber content (FIB); adjusted percent POL (PCC); soluble solids (BRIX); total recoverable sugars (ATR); and metric tons of ATR per hectare (ATR t. ha-1).
This indicates the existence of high genetic variability to be exploited between the genotypes analyzed concerning these traits, which are considered the most important factors in sugarcane production (Bastos et al., 2003). For PCC, statistically significant differences were observed in all regions, except SC, indicating that it is not possible to select genotypes with high sugar levels in this micro-region. The same finding was observed for the parameter ATR.
For the harvest cycles considered (plant crop and the 1st, 2nd, and 3rd ratoon crops, Table 3), significant differences were observed for all traits, except FIB in MB. For Rosse et al. (2002), these results indicate that harvest cycles represent environmental contrasts due to climate factors and therefore affect the traits evaluated in the present study. Silva (2008) investigated the interaction genotype-environment in sugarcane plantations in the state of São Paulo (SP), Brazil, and underline the fact that the higher mean square values based on site, as compared with other mean squares, signal the existence of considerable differences in yield potential of genotypes in the locations investigated. In the present study a large difference was observed in mean square values for harvest cycles in comparison with mean squares for genotype and the interaction genotype-harvest. Therefore, it may be said that genotypes differ as to yield potential in different harvest cycles, pointing to the need for continuous improvement in long-lived elite genetic material, that is, traits should remain essentially constant throughout harvest cycles.
The coefficients of variation varied from low to medium, according to the classification system proposed by Gomes (1990). Interestingly, in micro-region NW coefficient values were low (< 10) for all traits (Table 3).
The Scott and Knott test (Table 4) shows the emergence of elite genotypes throughout the sugarcane belt in PE, Brazil. In micro-region NC, for instance, genotypes SP79-1011, RB952692, and RB952675 stood out in terms of TPH and TCH. Genotypes RB813804, RB952749, RB952796, RB952754, RB952826, and RB952681 had interesting FIB values. Concerning PCC, except for RB952517 and RB952754, all other genotypes were classified into group ‘a’, with high potential for improvement in this richness trait. This was also valid for BRIX and ATR. For ATR t. ha-1, genotypes SP79-1011, RB952692, RB952675, and RB813804 presented the best performance, forming an elite group.
| Parameters | ||||||||
|---|---|---|---|---|---|---|---|---|
| Genotypes | TPH t.ha-1 | TCH t.ha-1 | FIB% | PCC% | BRIX% | ATR kg/t | ATR t.ha-1 | |
| SP79-1011 | 14.46a | 95.62a | 13.91b | 15.15a | 20.69a | 155.97a | 14.92a | |
| RB952692 | 13.44a | 87.37a | 12.54b | 15.42a | 20.64a | 158.14a | 13.81a | |
| RB952675 | 13.17a | 89.43a | 13.70b | 14.83a | 20.53a | 151.52a | 13.48a | |
| RB813804 | 12.74b | 81.31b | 14.55a | 15.71a | 21.39a | 162.32a | 13.18a | |
| RB763710 | 12.01b | 83.81b | 12.98b | 14.51a | 19.87a | 148.27a | 12.29b | |
| RB952571 | 11.64b | 78.68b | 14.09b | 14.98a | 21.07a | 152.27a | 11.87b | |
| RB952522 | 11.07c | 73.31c | 13.95b | 15.14a | 21.23a | 154.21a | 11.32c | |
| RB952749 | 10.64c | 72.25c | 15.18a | 14.84a | 20.95a | 151.91a | 10.90c | |
| RB952681 | 10.30c | 68.62c | 14.91a | 15.07a | 20.95a | 154.95a | 10.64c | |
| RB72454 | 10.23c | 68.06c | 12.85b | 15.25a | 20.37a | 156.97a | 10.55c | |
| RB952796 | 10.10c | 67.68c | 14.60a | 14.90a | 20.50a | 153.60a | 10.45c | |
| RB952826 | 10.09c | 70.43c | 15.10a | 14.30a | 20.04a | 147.24a | 10.44c | |
| RB952517 | 7.86d | 59.62d | 13.70b | 13.59b | 19.03b | 137.84b | 8.05d | |
| NC | RB952754 | 6.12e | 49.81e | 15.12ª | 12.36b | 17.81b | 126.95b | 6.33e |
| SC | RB813804 | 12.96a | 83.12a | 13.64a | 15.72a | 21.28a | 161.90a | 13.36a |
| SP78-4764 | 11.77a | 81.06a | 13.77a | 14.64a | 20.48a | 149.18a | 12.02a | |
| RB962675 | 11.69a | 76.81a | 12.50a | 15.19a | 20.52a | 155.28a | 11.96a | |
| RB952522 | 10.53a | 72.81b | 13.14a | 14.56a | 20.35a | 148.67a | 10.74a | |
| RB952692 | 10.34a | 71.15b | 13.08a | 14.68a | 20.23a | 149.94a | 10.57a | |
| SP79-1011 | 10.32a | 70.37b | 13.22a | 14.84a | 20.33a | 152.31a | 10.61a | |
| RB952511 | 10.30a | 68.81b | 12.31a | 15.00a | 20.36a | 152.99a | 10.52a | |
| RB953265 | 10.23a | 66.50b | 13.60a | 15.42a | 21.08a | 158.26a | 10.50a | |
| RB952754 | 10.07a | 69.50c | 13.42a | 14.63a | 20.32a | 149.29a | 10.29a | |
| RB952796 | 8.75a | 61.00c | 13.60a | 14.52a | 20.20a | 148.36a | 8.97b | |
| RB952904 | 7.58a | 52.43c | 13.21a | 14.64a | 20.43a | 149.04a | 7.72b | |
| RB952517 | 7.36a | 53.25c | 12.98a | 14.03a | 19.60a | 142.83a | 7.52b | |
| RB953002 | 6.54a | 46.93d | 13.88a | 14.02a | 19.68a | 143.09a | 6.70b | |
| RB953133 | 5.60ª | 39.02d | 13.66ª | 14.62a | 20.38a | 149.18a | 5.72b | |
| RB952675 | 15.71a | 117.31a | 13.06b | 13.44a | 18.35a | 138.01a | 16.16a | |
| RB813804 | 14.60a | 102.50b | 13.97b | 14.21a | 19.46a | 146.25a | 15.03a | |
| RB952875 | 14.58a | 108.68b | 11.84b | 13.38a | 17.97a | 137.18a | 14.98a | |
| SP79-1011 | 13.47b | 102.87b | 13.31b | 13.05a | 18.10a | 133.89a | 13.84b | |
| RB763710 | 13.47b | 108.87b | 12.65b | 12.31b | 17.21a | 125.81b | 13.76b | |
| RB942898 | 12.52c | 102.18b | 13.80b | 12.17b | 17.10a | 125.14b | 12.89b | |
| RB953155 | 12.50c | 105.68c | 12.77b | 11.72b | 16.34a | 120.70b | 12.88b | |
| RB72454 | 11.47c | 88.75c | 12.78b | 12.96b | 17.75a | 132.89b | 11.77c | |
| RB952884 | 11.29c | 92.50c | 16.14a | 12.19b | 17.66a | 125.60b | 11.67c | |
| RB952514 | 10.24d | 84.12c | 15.33a | 12.05b | 17.65a | 123.26b | 10.49d | |
| RB952517 | 10.23d | 86.31c | 12.48b | 11.72b | 16.59a | 119.83b | 10.48d | |
| RB952609 | 89.59e | 78.18d | 16.00a | 11.33b | 17.26a | 116.23b | 9.20e | |
| RB953245 | 79.93e | 66.56e | 14.60a | 11.70b | 17.01a | 120.90b | 8.22e | |
| NW | CP851491 | 55.13f | 45.12f | 15.24a | 11.98b | 17.39a | 122.97b | 5.67f |
| SP78-4764 | 11.60a | 82.37a | 15.25b | 13.92a | 20.11a | 145.24b | 12.09a | |
| SP80-1816 | 10.64a | 69.75b | 14.99b | 15.37a | 21.01a | 159.19a | 11.03a | |
| RB952511 | 10.44a | 76.50a | 14.89b | 13.74a | 19.24b | 141.33b | 10.75a | |
| SP79-1011 | 10.23a | 67.68b | 14.46b | 15.06a | 20.47a | 155.74a | 10.62a | |
| RB952749 | 9.75b | 68.62b | 15.83a | 14.26a | 19.92b | 147.42b | 10.11b | |
| RB952692 | 9.73b | 70.06b | 12.71c | 14.13a | 18.89b | 145.54b | 10.04b | |
| RB952571 | 9.44b | 67.12b | 15.00b | 14.17a | 19.77b | 145.84b | 9.74b | |
| RB952681 | 9.20b | 62.68b | 15.01b | 14.82a | 20.29a | 153.54a | 9.55b | |
| RB952522 | 9.05b | 64.18b | 13.72c | 14.19a | 19.35b | 146.09b | 9.34b | |
| RB952675 | 8.69b | 61.37b | 14.52b | 14.27a | 19.58b | 147.20b | 9.01b | |
| RB952517 | 8.64b | 61.75b | 12.72c | 14.13a | 19.05b | 145.01b | 8.91b | |
| RB952609 | 6.93c | 51.00c | 17.37a | 13.73a | 19.86b | 141.75b | 7.17c | |
| RB952754 | 6.83c | 50.37c | 16.19a | 13.79a | 19.42b | 142.67b | 7.06c | |
| SW | RB952597 | 6.21c | 45.12c | 15.42b | 13.97a | 19.64b | 143.82b | 6.41c |
| RB813804 | 9.85a | 71.33b | 15.23b | 13.46a | 19.94ª | 136.25a | 9.98a | |
| RB763710 | 9.82a | 78.41a | 13.31c | 12.46b | 18.37b | 125.84b | 9.91a | |
| RB892575 | 9.71a | 76.83a | 14.54b | 12.42b | 18.53b | 126.16b | 9.87a | |
| RB953265 | 9.51a | 70.66b | 14.16c | 13.30a | 19.92a | 133.26a | 9.54a | |
| SP79-1011 | 9.19a | 68.58b | 13.71c | 13.21a | 19.19a | 133.65a | 9.33a | |
| RB943365 | 8.02b | 63.41c | 14.93b | 12.70a | 18.92a | 128.61a | 8.13b | |
| RB953270 | 7.84b | 62.83c | 13.45b | 12.45b | 18.30b | 125.86b | 7.96b | |
| RB953206 | 7.64b | 57.41c | 14.66b | 13.18a | 19.33a | 133.57a | 7.76b | |
| IAC893143 | 7.42b | 62.83c | 13.60c | 11.71b | 17.62b | 118.49b | 7.51b | |
| RB953245 | 5.31c | 47.75d | 16.73a | 11.21b | 18.00b | 113.75b | 5.39c | |
| MB | RB953214 | 5.05c | 42.00d | 14.64b | 12.20b | 18.20b | 123.71b | 5.15c |
| CP851491 | 4.86c | 39.91d | 15.09b | 12.31b | 17.62b | 124.79b | 4.97c | |
NC: North Coast, SC: South Coast, NW: North Woodlands, SW: South Woodlands, MB: Mid Belt. Means followed by the same letter in a column indicate that values belong to the same group in the Scott and Knott test at 5% probability.
Table 4. Groupings of mean values of the traits polarizable sugars (POL) per hectare, in metric tons (TPH); culm productivity per hectare (TCH); fiber content (FIB); adjusted percent POL (PCC); soluble solids (BRIX); total recoverable sugars (ATR); and metric tons of ATR per hectare (ATR t. ha-1).
In micro-region SC, genotypes RB813804, SP78-4764, and RB962675 exhibited good TPH and TCH values. Concerning the traits FIB, PCC, BRIX, and ATR, genotypes exhibited essentially equivalent potential and were not classified into distinct groups. As for ATR t. ha-1, RB813804, SP7847-64, RB952522, RB952692, SP-79-1011, RB952511, RB953265, and RB952754 exhibited high potential, and were classified into group ‘a’.
In micro-region NW, genotypes RB952875, RB952675, and RB813804 presented the best performance, falling in group ‘a’ in the parameters TCH and ATR t. ha-1. Therefore, improvement programs in NW should be focused on the commercial value of genotype RB952675, since the TPH value was significant. Similarly, important findings in terms of energy generation were observed for genotypes RB952884, RB952609, RB952514, and CP85-1491, which were classified into group ‘a’ concerning the trait FIB, with values over 15%. These values indicate that these genotypes should be exploited specifically in the generation of bioenergy. However, for BRIX, genotypes were not included in any specific group, showing that they present the same potential.
In micro-region SW, genotypes SP78-4764, SP80-1816, RB952511, and SP79-1011 presented excellent performance in TCH and ATR t. ha-1, and were classified into group ‘a’. Similarly, SP78-4764 and RB952511 had high TPH value and were also included in the same group. Genotype RB952609 stood out due to the very high level of FIB, which rendered it the best genotype to be included in improvement programs addressing biomass and bioenergy production. Concerning the parameter PCC, no elite genotype groups were formed. BRIX values of genotypes SP78-4764, SP80-1816, SP79-1011, and RB952681 were high and prompted inclusion in group ‘a’. For ATR, SP79-1011, SP80-1816, and RB952681 also demonstrated superiority and were classified into group ‘a’.
In micro-region MB, RB813804, RB763710, RB892575, RB953265, and SP7910-11 were included in group ‘a’, with high performance for TCH and ATR t. ha-1. Genotypes RB763710 and RB892575 were included in group ‘a’ due to the good TPH values. Concerning FIB levels, genotype RB953245 exhibited the best performance. As for PCC and BRIX, genotypes RB813804, RB953265, SP79-1011, RB943365, and RB953206 were included in group ‘a’, and were superior to the other genotypes. In turn, genotypes RB813804, RB953265, SP79-1011, RB943365, and RB953206 presented the best performance and were included in group ‘a’.
Of the genetic parameters evaluated (Table 5), TPH, TCH, and ATR t. ha-1 presented high genetic variance, superior to the variance of the interaction genotype-harvest in all micro-regions evaluated.
| Genetic parameters | ||||||
|---|---|---|---|---|---|---|
| Environments | Traits |  |
 |
H2 | CVg | CVg / CVe |
| TPH | 4.59 | 0.83 | 94 | 19.48 | 2.0 | |
| TCH | 141.32 | 29.08 | 94 | 16.00 | 2.27 | |
| FIB | 0.69 | 0.16 | 86 | 5.92 | 0.82 | |
| NC | PCC | 0.61 | 0.18 | 84 | 5.33 | 0.75 |
| BRIX | 0.78 | 0.14 | 86 | 5.33 | 0.75 | |
| ATR | 68.0 | 23.0 | 82 | 5.40 | 0.72 | |
| ATR t.ha-1 | 4.82 | 0.91 | 94 | 19.40 | 1.88 | |
| TPH | 4.15 | 0.90 | 92 | 21.27 | 1.56 | |
| TCH | 158.94 | 28.33 | 94 | 19.33 | 1.86 | |
| FIB | 0.12 | 0.09 | 57 | 2.64 | 0.34 | |
| SC | PCC | 0.08 | 0.23 | 38 | 1.94 | 0.26 |
| BRIX | 0.09 | 0.13 | 50 | 1.51 | 0.31 | |
| ATR | 10.60 | 26.0 | 30 | 2.16 | 0.26 | |
| ATR t.ha-1 | 4.28 | 1.20 | 90 | 21.10 | 1.23 | |
| TPH | 7.70 | 0.94 | 95 | 23.89 | 2.57 | |
| TCH | 360.12 | 41.33 | 96 | 20.60 | 2.79 | |
| FIB | 1.76 | 0.31 | 91 | 9.59 | 1.17 | |
| NW | PCC | 0.57 | 0.18 | 84 | 6.10 | 0.80 |
| BRIX | 0.49 | 0.19 | 80 | 3.98 | 0.66 | |
| ATR | 62.68 | 16.08 | 85 | 6.19 | 0.80 | |
| ATR t.ha-1 | 8.15 | 0.95 | 96 | 23.92 | 2.54 | |
| TPH | 1.99 | 1.31 | 83 | 15.49 | 1.47 | |
| TCH | 87.24 | 49.24 | 85 | 14.55 | 1.65 | |
| FIB | 1.44 | 0.14 | 92 | 8.08 | 1.06 | |
| SW | PCC | 0.17 | 0.09 | 71 | 2.93 | 0.49 |
| BRIX | 0.29 | 0.05 | 86 | 2.73 | 0.79 | |
| ATR | 21.18 | 10.09 | 75 | 3.12 | 0.55 | |
| ATR t.ha-1 | 2.17 | 1.14 | 83 | 15.64 | 1.50 | |
| TPH | 2.79 | 1.98 | 78 | 21.29 | 1.96 | |
| TCH | 130.88 | 82.4 | 80 | 18.50 | 1.72 | |
| FIB | 0.53 | 0.83 | 58 | 5.05 | 0.73 | |
| MB | PCC | 0.26 | 0.39 | 58 | 4.06 | 0.69 |
| BRIX | 0.30 | 0.47 | 56 | 2.93 | 0.61 | |
| ATR | 26.11 | 35.79 | 56 | 4.02 | 0.68 | |
| ATR t.ha-1 | 2.81 | 1.98 | 78 | 21.08 | 1.97 | |
NC: North Coast, SC: South Coast, NW: North Woodlands, SW: South Woodlands, MB: Mid Belt.
Table 5. Genetic parameters associated with the traits polarizable sugars (POL) per hectare, in metric tons (TPH); culm productivity per hectare (TCH); fiber content (FIB); adjusted percent POL (PCC); soluble solids (BRIX); total recoverable
 Genetic variance component.
 Interaction genotype-harvest variance component.
h2: Genotypic determination at mean level.
CVg: Genetic variance coefficient.
CVg / CVe: b index.
Such a result is highly desirable, since, according to Dutra Filho (2008a), it indicates that the expression of this important production aspect is mostly due to the genetic effects, suggesting the feasibility to select elite genotypes in the sugarcane belt in PE, Brazil. Concerning ATR t.ha-1, it should be emphasized that the results obtained are highly significant, pointing to the possibility to increase sugarcane productivity significantly in PE and, therefore, to secure better return on investment, since sugarcane prices are defined based on ATR t.ha-1 in Brazil.
For the traits PCC, BRIX, and ATR t.ha-1, selecting elite genetic material is possible only in micro-regions NC, NW, and SW, where genetic variance was higher than the variance in the interaction genotype-harvest. Concerning FIB, only micro-region MB affords to select elite genotypes (Table 5).
The mean heritability coefficient values were high (> 75%) for TPH, THC, and ATR t.ha-1 in all micro-regions (Table 5). For Falconer (1987), such a scenario is highly favorable in the selection of elite genotypes based on these traits, since it indicates the robustness of phenotypical value as an indicator of genotypic value. These results confirm previous findings by Dutra Filho et al. (2008b), in a study that evaluated the progeny of sugarcane in NL at the early improvement stage, and endorse the results published by Melo et al. (2006), who assessed sugarcane genotypes from NW. We also observed that the mean heritability coefficient for TPH was higher than that obtained by Souza et al. (2012) in MB. According to Melo et al. (2009), these interesting heritability coefficients translate as an important aspect in genetic improvement programs, since they clearly show that it is possible to obtain significant genetic advantages in the selection of elite genotypes considering these traits. Since heritability is defined as the transferrable part of the total genetic heritability, Gonçalves et al. (2007) highlight the fact that it is possible to improve production using genotypes with higher performance in these traits obtained crossing the appropriate genetic materials. Mean heritability coefficients were also high for the traits FIB, PCC, BRIX, and ATR t.ha-1 considering the edaphic and climatic conditions in NC, NW, and SW in PE, Brazil. This indicates that elite genotypes should be exploited based on these traits in these micro-regions.
The selection of elite genotypes in the sugarcane belt in PE should be based on TPH, TCH, and ATR t.ha-1. These traits presented the highest genetic variability, with genetic variation coefficients above 10% in all micro-regions (Table 5). According to Oliveira et al. (2008), genetic variation coefficients above 10% are considered high. The ratio of the genetic variation coefficient to the experimental variation coefficient (index b) were above 1 for the traits TPH, TCH, and ATR t.ha-1 (Table 5), showing that these traits are essential in the expression of genetic variability between the genotypes evaluated in the sugarcane belt in PE, Brazil, and lending strength to the hypothesis that selection may become more effective.
Also, r (Table 6) was higher than 0.5 for TPH, TCH, and ATR t.ha-1 across the sugarcane belt in PE, in the three methodologies used. However, in NC and SC, values of r were above 0.75. In NW, r values were considered excellent using the three methodologies, with values over 0.85. For Santos (2004), these results indicate superior genetic control in the expression of these traits in the genotypes evaluated. Consequently, these traits are more evenly expressed across the harvest cycles of sugarcane in the region, which increases ratoon longevity. Cruz and Regazzi (2011) also underline the fact that the higher the r value, the lower the number of measurements required to predict the actual value of genotypes.
| ANOVA | PCA | AS | |||||
|---|---|---|---|---|---|---|---|
| Environments | Traits | r | R2 | r | R2 | r | R2 |
| TPH | 0.79 | 94.00 | 0.82 | 95.00 | 0.80 | 94.34 | |
| TCH | 0.79 | 93.67 | 0.83 | 95.01 | 0.79 | 94.00 | |
| FIB | 0.61 | 86.34 | 0.63 | 87.00 | 0.62 | 87.00 | |
| NC | PCC | 0.57 | 84.00 | 0.63 | 87.00 | 0.62 | 87.00 |
| BRIX | 0.60 | 86.00 | 0.69 | 90.00 | 0.63 | 87.00 | |
| ATR | 0.54 | 82.00 | 0.58 | 84.00 | 0.56 | 84.00 | |
| ATR t.ha-1 | 0.78 | 94.00 | 0.81 | 95.00 | 0.80 | 94.00 | |
| TPH | 0.75 | 92.00 | 0.79 | 94.00 | 0.79 | 94.00 | |
| TCH | 0.79 | 94.00 | 0.81 | 95.00 | 0.82 | 95.00 | |
| FIB | 0.25 | 57.00 | 0.27 | 61.00 | 0.28 | 61.10 | |
| SC | PCC | 0.13 | 38.00 | 0.18 | 48.00 | 0.14 | 39.00 |
| BRIX | 0.19 | 49.00 | 0.28 | 61.00 | 0.18 | 47.00 | |
| ATR | 0.13 | 39.00 | 0.21 | 52.00 | 0.14 | 40.00 | |
| ATR t.ha-1 | 0.74 | 92.00 | 0.79 | 94.00 | 0.79 | 93.00 | |
| TPH | 0.85 | 96.00 | 0.86 | 96.00 | 0.86 | 96.00 | |
| TCH | 0.86 | 96.00 | 0.87 | 96.00 | 0.87 | 96.00 | |
| FIB | 0.73 | 91.00 | 0.75 | 92.00 | 0.74 | 92.00 | |
| NW | PCC | 0.58 | 84.00 | 0.65 | 88.00 | 0.61 | 86.00 |
| BRIX | 0.50 | 80.00 | 0.61 | 86.00 | 0.56 | 84.00 | |
| ATR | 0.60 | 86.00 | 0.65 | 88.00 | 0.63 | 87.00 | |
| ATR t.ha-1 | 0.86 | 96.00 | 0.87 | 96.00 | 0.87 | 96.00 | |
| TPH | 0.55 | 82.00 | 0.61 | 86.00 | 0.62 | 87.00 | |
| TCH | 0.59 | 85.00 | 0.62 | 87.00 | 0.65 | 88.00 | |
| FIB | 0.75 | 92.00 | 0.85 | 96.00 | 0.81 | 94.00 | |
| SW | PCC | 0.38 | 71.00 | 0.40 | 72.00 | 0.43 | 76.00 |
| BRIX | 0.62 | 87.00 | 0.72 | 91.00 | 0.62 | 87.00 | |
| ATR | 0.43 | 75.00 | 0.47 | 78.00 | 0.46 | 77.00 | |
| ATR t.ha-1 | 0.55 | 83.00 | 0.61 | 86.00 | 0.63 | 87.00 | |
| TPH | 0.54 | 78.00 | 0.93 | 97.00 | 0.59 | 78.00 | |
| TCH | 0.62 | 83.00 | 0.90 | 96.00 | 0.70 | 87.00 | |
| FIB | 0.31 | 58.00 | 0.40 | 67.00 | 0.36 | 63.00 | |
| MB | PCC | 0.31 | 58.00 | 0.63 | 84.00 | 0.26 | 52.00 |
| BRIX | 0.30 | 56.00 | 0.57 | 80.00 | 0.26 | 51.00 | |
| ATR | 0.33 | 60.00 | 0.64 | 84.00 | 0.27 | 53.00 | |
| ATR t.ha-1 | 0.55 | 78.00 | 0.93 | 97.00 | 0.60 | 78.00 | |
NC: North Coast, SC: South Coast, NW: North Woodlands, SW: South Woodlands, MB: Mid Belt.
r: Repeatability coefficient
R²: Determination coefficient
Table 6. Repeatability coefficient (r) values for the traits polarizable sugars (POL) per hectare, in metric tons (TPH); culm productivity per hectare (TCH); fiber content (FIB); adjusted percent POL (PCC); soluble solids (BRIX); total recoverable sugars (ATR); and metric tons of ATR per hectare (ATR t.ha-1) of sugarcane genotypes evaluated in experiments conducted in the sugarcane belt in the state of Pernambuco (PE), Brazil.
Similarly, the values of the traits FIB, PCC, BRIX, and ATR t.ha-1 were regularly repeated in the genotypes evaluated in NC and NW, PE using the three methodologies. In SW, FIB and BRIX also exhibited consistent repeatability, in the three methods. However, in MB only the traits PCC, BRIX, and ATR t.ha-1 were regularly repeated, in PCA.
The estimated number of repeated measurements required to select genotypes with 80%, 90%, and 95% predictability of actual values are shown in Table 7.
| ANOVA | PCA | SA | ||||||||
| Traits | R2=0.8 | R2=0.9 | R2=0.95 | R2=0.8 | R2=0.9 | R2=0.95 | R2=0.8 | R2=0.9 | R2=0.95 | |
| TPH | 1.05 | 2.36 | 5.0 | 0.87 | 1.97 | 4.1 | 0.96 | 2.15 | 4.5 | |
| TCH | 1.08 | 2.42 | 5.0 | 0.84 | 1.88 | 3.9 | 1.01 | 2.33 | 4.9 | |
| FIB | 2.53 | 5.69 | 12.0 | 2.39 | 5.39 | 11.39 | 2.51 | 5.62 | 11.88 | |
| NC | PCC | 3.06 | 6.99 | 14.0 | 2.41 | 5.42 | 11.45 | 2.77 | 6.23 | 13.15 |
| BRIX | 2.66 | 5.98 | 12.64 | 1.83 | 2.60 | 8.73 | 2.30 | 5.18 | 1.00 | |
| ATR | 3.36 | 7.57 | 16.00 | 2.78 | 6.26 | 13.21 | 3.12 | 7.02 | 14.83 | |
| ATR t.ha-1 | 1.10 | 2.46 | 5.20 | 0.90 | 2.04 | 4.31 | 0.99 | 2.24 | 4.73 | |
| TPH | 1.34 | 3.02 | 6.39 | 1.02 | 2.31 | 4.89 | 1.03 | 2.33 | 4.91 | |
| TCH | 1.05 | 2.37 | 5.01 | 0.88 | 1.98 | 4.18 | 0.88 | 1.99 | 4.20 | |
| FIB | 11.89 | 26.76 | 56.50 | 8.87 | 19.96 | 42.13 | 10.18 | 22.91 | 48.37 | |
| SC | PCC | 26.61 | 59.18 | 126.41 | 17.39 | 39.14 | 82.00 | 24.79 | 55.79 | 117.78 |
| BRIX | 16.32 | 36.72 | 77.52 | 10.10 | 22.73 | 48.00 | 17.67 | 39.77 | 84.00 | |
| ATR | 24.70 | 55.58 | 117.35 | 14.92 | 33.57 | 71.00 | 23.67 | 53.27 | 112.00 | |
| ATR t.ha-1 | 1.39 | 3.14 | 6.63 | 1.06 | 2.39 | 5.06 | 1.07 | 2.41 | 5.09 | |
| TPH | 0.68 | 1.52 | 3.21 | 0.63 | 1.42 | 3.01 | 0.63 | 1.43 | 3.01 | |
| TCH | 0.62 | 1.40 | 2.96 | 0.59 | 1.34 | 2.84 | 0.60 | 1.35 | 2.86 | |
| FIB | 1.48 | 3.34 | 7.06 | 1.32 | 2.97 | 6.26 | 1.40 | 3.16 | 6.69 | |
| NW | PCC | 2.93 | 6.61 | 13.95 | 2.19 | 4.93 | 10.40 | 2.54 | 5.73 | 12.10 |
| BRIX | 3.96 | 9.91 | 18.81 | 2.53 | 5.70 | 12.40 | 3.13 | 7.04 | 14.87 | |
| ATR | 2.66 | 6.00 | 12.66 | 2.10 | 2.97 | 9.98 | 2.34 | 5.27 | 11.26 | |
| ATR t.ha-1 | 0.65 | 1.48 | 3.12 | 0.60 | 1.37 | 2.88 | 0.60 | 1.36 | 2.89 | |
| TPH | 3.33 | 7.42 | 15.67 | 2.55 | 5.75 | 12.15 | 2.42 | 5.45 | 11.50 | |
| TCH | 2.79 | 6.29 | 13.29 | 2.14 | 4.81 | 10.16 | 2.19 | 4.93 | 10.41 | |
| FIB | 1.30 | 2.93 | 6.19 | 0.73 | 1.64 | 3.48 | 0.96 | 2.17 | 4.59 | |
| SW | PCC | 6.46 | 14.54 | 30.70 | 3.43 | 8.87 | 18.76 | 5.15 | 11.60 | 24.48 |
| BRIX | 2.46 | 5.54 | 11.70 | 1.58 | 3.57 | 7.54 | 2.46 | 5.54 | 11.70 | |
| ATR | 5.34 | 12.02 | 25.37 | 3.81 | 8.57 | 18.10 | 4.70 | 10.58 | 22.34 | |
| ATR t.ha-1 | 3.24 | 7.30 | 15.41 | 2.28 | 5.14 | 10.85 | 2.35 | 5.29 | 11.7 | |
| TPH | 3.35 | 7.55 | 15.94 | 0.32 | 0.72 | 1.53 | 2.74 | 6.16 | 13.02 | |
| TCH | 2.41 | 5.42 | 11.45 | 0.44 | 1.00 | 2.12 | 1.66 | 3.74 | 7.91 | |
| FIB | 8.63 | 19.42 | 41.00 | 5.97 | 13.43 | 28.36 | 7.09 | 15.95 | 33.68 | |
| MB | PCC | 8.68 | 19.54 | 41.00 | 2.35 | 5.29 | 11.18 | 11.10 | 24.77 | 52.73 |
| BRIX | 9.48 | 21.35 | 45.04 | 3.06 | 6.90 | 14.57 | 11.59 | 26.09 | 55.09 | |
| ATR | 8.13 | 18.29 | 38.62 | 2.27 | 5.12 | 10.82 | 10.85 | 24.42 | 51.55 | |
| ATR t.ha-1 | 3.33 | 7.49 | 15.81 | 0.32 | 0.72 | 1.53 | 2.65 | 5.97 | 12.60 | |
NC: North Coast, SC: South Coast, NW: North Woodlands, SW: South Woodlands, MB: Mid Belt.
ANOVA: Analysis of variance; PCA: Principal component analysis; SA: Structured data analyses
Table 7. Number of measurements required to select superior sugarcane genotypes considering the traits polarizable sugars (POL) per hectare, in metric tons (TPH); culm productivity per hectare (TCH); fiber content (FIB); adjusted percent POL (PCC); soluble solids (BRIX); total recoverable sugars (ATR); and metric tons of ATR per hectare (ATR t.ha-1) of sugarcane genotypes evaluated in experiments conducted in the sugarcane belt in the state of Pernambuco (PE), Brazil.
Resende (2002) concluded that determination coefficients above 80% afford appropriate predictive power for the actual value of an individual and, consequently, the number of measurements required for selection. Therefore, it becomes clear that the traits TPH, TCH, and ATR t. ha-1 require no more than two evaluations to select elite genotypes intended for commercial sugarcane plantations in the sugarcane belt in PE, with predictability of 90% of actual values for each trait in NC and NW, using the three methodologies. Similarly, predictability above 80% was observed for SC and SW using the three methodologies, and for MB using PCA and SA.
Concerning the trait FIB, two assessments are enough to select elite genotypes with 80% predictability of actual values for growth in micro-regions NC, NW, and SW, using the three methodologies. In micro-regions SC and MB at least four evaluations, or four harvests, are required to select genotypes with the same 80% predictability level, which is economically unfeasible (Table 7).
For PCC, two evaluations are enough to select genotypes with 80% predictability of actual values using PCA and SA in NC and NW, respectively. For micro-region MB, two evaluations are required to select genotypes with 80% predictability of actual values in a PCA. For micro-region SC, more than four evaluations are necessary (Table 7).
In turn, for the trait BRIX, two evaluations suffice to select genotypes with 80% predictability of actual values in micro-regions NC and SW. For micro-regions NW and MB, two and three evaluations are required, respectively, to select genotypes with 80% predictability, using PCA (Table 7).
For ATR t.ha-1, three evaluations are necessary to select genotypes with 80% predictability of actual values in micro-region NC, in the three methods used, while for micro-region NW two evaluations are required using the three methods. For SW, three evaluations should be carried out, using PCA. For MB, two assessments are necessary using the same method (Table 7).
In estimating the number of measurements, the PCA was more effective than ANOVA and SA to select elite genotypes considering PCC in micro-regions SW and MB. The same was observed for the trait BRIX in micro-regions NW and MB, and for ATR in SW and MB. For Cruz and Regazzi (2001), the experimental error component is more effectively eliminated in the PCA than in the ANOVA. Despite that, the number of assessments required to select superior genotypes with 80% predictability of the actual value in SC, in the three methodologies used, is much higher than four.
In this sense, it is important to evaluate the genotypic stabilization of materials evaluated under the edaphic and climatic conditions in micro-region SC (Table 8).
| Trait | Correlation / No of assessments | ANOVA | R2 | CP | R2 |
|---|---|---|---|---|---|
| 1-2 | 0.82 | 89.91 | 0.88 | 93.47 | |
| 2-3 | 0.64 | 78.39 | 0.66 | 79.62 | |
| TPH | 3-4 | 0.85 | 92.15 | 0.89 | 94.26 |
| 1-3 | 0.72 | 88.41 | 0.75 | 89.97 | |
| 2-4 | 0.73 | 89.23 | 0.81 | 92.57 | |
| 1-4 | 0.75 | 92.24 | 0.80 | 93.95 | |
| 1-2 | 0.87 | 93.22 | 0.88 | 93.64 | |
| 2-3 | 0.72 | 83.92 | 0.73 | 84.11 | |
| TCH | 3-4 | 0.84 | 91.23 | 0.88 | 93.77 |
| 1-3 | 0.78 | 91.37 | 0.78 | 91.56 | |
| 2-4 | 0.78 | 91.35 | 0.83 | 93.42 | |
| 1-4 | 0.79 | 93.81 | 0.82 | 94.78 | |
| 1-2 | -0.07 | 0 | 0.07 | 13.69 | |
| 2-3 | 0.26 | 41.00 | 0.26 | 41.38 | |
| FIB | 3-4 | 0.34 | 51.20 | 0.35 | 51.74 |
| 1-3 | 0.13 | 31.16 | 0.16 | 36.97 | |
| 2-4 | 0.27 | 52.60 | 0.28 | 54.20 | |
| 1-4 | 0.25 | 57.35 | 0.31 | 64.33 | |
| 1-2 | 0.16 | 27.72 | 0.16 | 2.77 | |
| 2-3 | -0.08 | 0 | 0.08 | 1.40 | |
| PCC | 3-4 | 0.04 | 7.58 | 0.04 | 7.71 |
| 1-3 | 0.06 | 15.12 | 0.08 | 20.84 | |
| 2-4 | 0.10 | 23.96 | 0.18 | 39.62 | |
| 1-4 | 0.13 | 37.54 | 0.18 | 46.87 | |
| 1-2 | 0.20 | 32.91 | 0.20 | 3.29 | |
| 2-3 | 0.07 | 13.17 | 0.07 | 13.55 | |
| BRIX | 3-4 | 0.02 | 3.71 | 0.02 | 3.75 |
| 1-3 | 0.09 | 23.65 | 0.10 | 25.65 | |
| 2-4 | 0.23 | 46.57 | 0.27 | 52.23 | |
| 1-4 | 0.20 | 49.50 | 0.24 | 55.32 | |
| 1-2 | 0.22 | 35.65 | 0.22 | 35.74 | |
| 2-3 | -0.09 | 0 | 0.09 | 17.08 | |
| ATR | 3-4 | 0.00 | 0 | 0.00 | 0.07 |
| 1-3 | 0.07 | 19.42 | 0.11 | 26.81 | |
| 2-4 | 0.09 | 22.87 | 0.20 | 42.99 | |
| 1-4 | 0.14 | 3.93 | 0.19 | 49.20 | |
| 1-2 | 0.81 | 89.34 | 0.87 | 93.28 | |
| 2-3 | 0.63 | 77.61 | 0.65 | 79.01 | |
| ATR t.ha-1 | 3-4 | 0.85 | 91.72 | 0.88 | 93.69 |
| 1-3 | 0.71 | 87.99 | 0.74 | 89.73 | |
| 2-4 | 0.73 | 88.87 | 0.80 | 92.29 | |
| 1-4 | 0.74 | 91.97 | 0.79 | 93.75 |
Table 8. Genotypic stabilization of sugarcane genotypes considering the traits polarizable sugars (POL) per hectare, in metric tons (TPH); culm productivity per hectare (TCH); fiber content (FIB); adjusted percent POL (PCC); soluble solids (BRIX); total recoverable sugars (ATR); and metric tons of ATR per hectare (ATR t.ha-1) evaluated in experiments conducted in the sugarcane belt in the state of Pernambuco (PE), Brazil.
Genotypic stabilization is obtained based on the correlations between all measurements carried out. Concerning FIB, for instance, the correlation between the values obtained in plant crop and the 1st and 2nd harvests was negative in ANOVA and very low in PCA. This explains the low R² value, which was zero using ANOVA and only 13.69 using PCA. This explains the need for a significantly higher number of evaluations required to predict the actual value of genotypes. The poor correlation between the measurements the present study indicates the severe climatic variations between harvest years, which negatively influence the regularity of expression of these traits in micro-region SC. However, this was not observed for TPH, when the high correlations between measurements both in ANOVA and in PCA were high, increasing R² values and reducing the number of measurements required to predict the actual value of genotypes.
However, as previously demonstrated for the estimation of genetic traits the selection of superior genotypes in the commercial growth of sugarcane in the sugarcane belt in PE, Brazil should be carried out based on the traits TPH, TCH, and ATR t.ha-1. Also, considering r values, the traits were regularly expressed in the genotypes evaluated, and two measurements are enough to select superior genotypes with 80% predictability of actual values. Pedroso et al. (2011) evaluated sugarcane families grown in the state of Minas Gerais, Brazil, and obtained high repeatability values, concluding that the selection of these families based on two harvests and of clones during the 2nd harvest may be an interesting option in improvement programs, increasing the efficiency in the production of cultivars. Therefore, the results of the present study afford to reduce the time-to-market of new cultivars by three years in the sugarcane belt in PE, Brazil.
Conclusion
The use of two evaluations in the beginning of experiments was enough to select superior genotypes in the sugarcane belt in PE, Brazil. It is possible to reduce the time-to-market of new sugarcane cultivars by three harvest years in the sugarcane belt in PE, Brazil, which affords to decrease labour costs significantly. The best cultivars in micro-region NC were SP79-1011, RB952692, RB952675, and RB813804. For micro-region SC, the best cultivars were RB813804, SP78-4764, RB952675, RB952522, RB952692, SP79-1011, RB952511, RB953265, and RB952754. In NW, the best cultivars were RB952675, RB813804, RB952875, and RB952675, while in SW the best cultivars were SP78-4764, SP80-1816, RB952511, and RB952675. For MB, the best cultivars were RB813804, RB763710, RB892975, RB953265, and SP79-1011.
Conflicts of interest
The authors declare that they have no conflicts of interest.
Acknowledgment
CAPES - BRAZIL by grant of scholarship.
RIDESA - Interuniversity Network for the Development of the Sucroenergetic Sector for the granting of genotypes for research.
About the Authors
Corresponding Author
J.A. Dutra Filho
Unidade Academic de Ciências Agrárias, Brazil
- Email:
- joaodutrafilho7@gmail.com
References
- Abeywardena V (1972). An application of principal component analysis in genetics. J. Gen. 16(01): 27-51. https://doi.org/10.5772/38049
- Barbosa MHP, Silveira LCI (2012). Melhoramento Genético e Recomendação de cultivares. In: Cana-de-açúcar Bioenergia, Açúcar e Etanol – Tecnologias e Perspectivas (Santos F, Borém A and Caldas C, eds.). UFV, Viçosa, 313-353.
- Barbosa MHP, Resende MD, Silveira LCI, Peternelli AL (2005). Estratégias de melhoramento genético da cana-de-açúcar em universidades. In: IX Simpósio sobre seleção recorrente. UFLA, Lavras.
- Bastos IT, Barbosa MHP, Cruz CD, Burniquist WL, et al. (2003). Análise dialélica em clones de cana-de-açúcar. Bragantia 62(02): 199-206.
- Biosev, A. Louis Dreyfus Commodities Company. Available at [http://www.biosev.com]. Accessed April 4, 2013.
- Cochran WG (1974). The combination of Estimates form Different Experiments. Biometrics 10(01): 101-129. https://doi.org/10.2307/3001666
- Coelho COC, Carrazoni PG, Monteiro VLC, Melo FAD, et al. (2001). Biopolímero produzido a partir da cana-de-áçucar para cicatrização cutânea. Acta Cir. Bras. 17(8): 11-13. https://doi.org/10.1590/s0102-86502002000700003
- CONAB, Companhia Nacional de Abastecimento. Available at [http://www.conab.gov.br]. Accessed April 4, 2013.
- Cruz CD (2006a). Programa Genes: Estatística experimental e matrizes. UFV, Viçosa, Brazil.
- Cruz CD (2006b). Programa Genes: Biometria. UFV, Viçosa, Brazil.
- Cruz CD and Regazzi A (2001). Modelos biométricos aplicados ao melhoramento genético .ed. rev. UFV, Viçosa, Brazil.
- Dos Santos MSM, Madalena JA, Soares L, Ferreira PV, et al. (2004). Repetibilidade de características agroindustriais em cana-de-açúcar Pesq. Agropec. Bras. 39(04): 301-306. https://doi.org/10.1590/s0100-204x2004000400001
- Dutra Filho JA, Bastos GQ, Resende LV, Simões Neto DE, et al. (2011b). Avaliação agroindustrial e dissimilaridade genética em progênies e variedades RB de cana-de-açúcar. Agropec. Téc. 32(1): 55-61.
- Dutra Filho JA, T Melo LJO, Resende LV, Anunciação Filho CJ, et al. (2011a). Aplicação de técnicas multivariadas no estudo da divergência genética em cana-de-açúcar. Rev. Ciênc. Agron. 42(1): 185-192. https://doi.org/10.1590/s1806-66902011000100023
- Falconer DS (1987). Introdução a genética quantitativa. UFV, Viçosa, Brazil.
- Fernandes AC (2003). Cálculos na agroindustria da cana-de-açúcar. 2. ed. EME, Piracicaba, Brazil.
- Ferreira A, Barbosa MHP, Cruz CD, Hoffmann HP, et al. (2005). Repetibilidade e número de colheitas para a seleção de clones de cana-de-açúcar. Pesq. Agropec. Bras. 40(8): 761-767. https://doi.org/10.1590/s0100-204x2005000800005
- Gomes PF (1990). Curso de estatística experimental, 13. ed. USP, Piracicaba.
- Gonçalves GM, Viana AP, Bezeera Neto FV, Pereira MG, et al. (2007). Seleção e herdabilidade na produção de ganhos genéticos em maracujá amarelo. Pesq. Agropec. Bras. 42(02): 193-198. https://doi.org/10.1590/s0100-204x2007000200007
- Koffler NF, Lima JFWF, De Lacerda MF, Santana JF, et al. (1986). Caracterização edafo-climática das regiões canavieiras do Brasil: PERNAMBUCO. IAA/PLANALSUCAR, Piracicaba, Brazil.
- Mansour H, Nordheim EV, Ruledge JJ (1981). Estimators of repeatability, Theor. Appl. Gen. 60(03): 151-156. https://doi.org/10.1007/bf00264520
- Melo LJOT, Oliveira FJ, Bastos GQ, Anunciação Filho CJ, et al. (2009). Desempenho agroindustrial de cultivares de cana-de-açúcar na zona da mata litoral sul de Pernambuco. Ciênc. Agrotecnol. 33(03): 684-691. https://doi.org/10.1590/s1413-70542009000300004
- Melo LJTO, Oliveira FJ, Bastos GQ, Anunciação Filho CJ, et al. (2006). Interação genótipo × ciclos de colheita de cana-de-açúcar da Zona da mata Norte de Pernambuco. Bragantia 65(02): 197-205. https://doi.org/10.1590/s0006-87052006000200002
- Oliveira RA, Daros E, Bespalhok-Filho JC, Zambon JLC, et al. (2008). Seleção de famílias de cana-de-açúcar via modelos mistos. Sci. Agrária 09(03): 269-274. https://doi.org/10.5380/rsa.v9i3.11564
- Pedroso CA, Barbosa MHP, Silva FL, Resende MDV, et al. (2011). Repeatability of full-sib sugarcane families across harvests and the efficiency of early selection. Euphytica 182(3): 423-430. https://doi.org/10.1007/s10681-011-0521-z
- Resende MDV (2002). Genética biométrica e estatística no melhoramento de plantas perenes. Embrapa Informação Tecnológica, Brasília, Brazil.
- Rosse LN, Vencovsky R, Ferreira DF. (2002). Comparação de métodos de regressão para avaliar a estabilidade fenotípica em cana-de-açúcar. Pesq. Agropec. Bras. 37(1): 25-32. https://doi.org/10.1590/s0100-204x2002000100004
- Scott AJ and Knott M (1974). A cluster analysis method for grouping means in the analysis of variance. Biometrics 30(3): 507-512. https://doi.org/10.2307/2529204
- Silva MA (2008). Interação genótipo × ambiente e estabilidade fenotípica de cana-de-açúcar em ciclo de cana de ano. Bragantia 67(1): 109-117. https://doi.org/10.1590/s0006-87052008000100013
- Souza PHN, Bastos GQ, Anunciação Filho CG, Dutra Filho JA, et al. (2012). Avaliação de genótipos de cana-de-açúcar para início de safra na Microrregião Centro de Pernambuco. Rev. Ceres 59(5): 427-432. https://doi.org/10.1590/s0034-737x2012000500013
- Stolf R (1986). Metodologia de avaliação de falhas nas linhas de cana-de-açúcar. STAB, Piracicaba 4: 22-36.
- Única, União da Indústria da Cana-de-Açúcar. Available at [http://www.unica.com.br]. Accessed April 4, 2013.
Keywords:
Download:
Full PDF- Share This