Correlation study of resistance components in the selection of Capsicum genotypes resistant to the fungus Colletotrichum gloeosporioides
Accepted: November 30, -0001
Published: August 17, 2017
Genet.Mol.Res. 16(3): gmr16039720
DOI: 10.4238/gmr16039720
Abstract
Anthracnose is among the major diseases of the Capsicum culture. It is caused by different species of the genus Colletotrichum, which may result in major damages to the cultivation of this genus. Studies aiming to search for cultivars resistant to diseases are essential to reduce financial and agricultural losses. The objective of this study was to evaluate the correlation between the variables analyzed to select Capsicum genotypes resistant to the fungus Colletotrichum gloeosporioides. The experimental design was completely randomized blocks with three replications, 88 treatments, four ripe fruits, and four unripe fruits per replication. Accessions of Capsicum from the Germplasm Active Bank of Universidade do Estado de Mato Grosso (UNEMAT) were evaluated as for resistance to the fungus. Fruits were collected from each plot and taken to the laboratory for disinfestation. A lesion was performed in the middle region of the fruit using a sterile needle, where a spore suspension drop, adjusted to 106 spores/mL, was deposited. An ultrapure water drop was deposited into control fruits. The fruits were placed in humid chambers, and the evaluation was performed by measuring the diameter and the length of lesions using a caliper for 11 days. After data were obtained, analyses of variance, correlation, and path analysis were performed using the GENES software and R. According to the likelihood-ratio test, the effects of genotypes (G), fruit stage (F), and its interaction (G x F) were significant (P < 0.05). There were differences between the magnitudes of genotype correlations according to fruit stage. Different variables must be taken into account for an indirect selection in this culture in function of fruit stage since the variable AUDPC is an important criterion for selecting resistant accessions. We found through the path analysis that the variables DULRD and DULRL exerted the greatest effects on AUDPC.
Introduction
Hot and sweet peppers are part of the Solanaceae family and the genus Capsicum, with over 31 described species. Only five of them are domesticated (Capsicum annuum var. annuum; Capsicum baccatum var. pendulum and umbilicatum; Capsicum chinense; Capsicum frutescens; and Capsicum pubescens) (Moscone et al., 2007). Capsicum species are known for their high variety of shapes, colors, and fruit sizes and by poignancy in most species, attracting the attention of various business sectors (Da Silva et al., 2011). Among the botanical characteristics of these species, hermaphrodite and autogamous flowers can be mentioned. In many Capsicum species, allogamy rates may reach 90%, being classified as an intermediate or optional allogamy. Flowers have a cup with five to eight sepals and a corolla with five to eight petals. They are commonly used for species identification (Costa et al., 2008).
Even taking all the necessary precautions indicated for the planting and the maintenance of the culture besides the inclusion of new technologies to the production system, various pests and diseases cause damage to the cultivation of sweet and hot peppers. It is a limiting factor to production and fruit quality. Among the major diseases of Capsicum, there is anthracnose (França et al., 2015). Anthracnose in Capsicum is a disease with a complex etiology caused by different species of Colletotrichum such as C. gloeosporioides, C. capsici, C. acutatum, C. dematium, and C. coccodes. The species C. gloeosporioides and C. acutatum are the most relevant. They are mentioned as the main species causing anthracnose in Brazil. Anthracnose in Capsicum is a commercially important disease. Its occurrence in producing areas is a limiting factor to production, as it has a high potential to cause losses of up to 100% in the quantity and quality of production, resulting in great losses to the producer and the local agriculture, especially during fruit storage. The spread of the fungus usually happens in crops in open field during hot and wet periods and where there is the presence of water. It is considered a fruit disease, causing great losses in yield and liquidity during the post-harvest stage. In fruits, the pathogen causes necrotic and circular lesions with a dark color, whose diameters may vary, where a conidial mass emerges and spreads (Pereira et al., 2011).
Research has been developed with the purpose of launching materials resistant to various pathogens, including anthracnose, but the progress towards achieving a durable resistance has been limited by the lack of natural resistance in Germplasm banks of C. annuum (Ranathunge et al., 2012). Due to huge losses caused by anthracnose, it is essential that studies be conducted to increase the knowledge about its biology, genetics, and pathogenesis to reduce financial and agricultural losses caused by the fungus C. gloeosporioides.
Most plant breeding programs aim to search for improvements in some traits with an agronomic interest, in which multiple traits are considered simultaneously during the assessment aiming to achieve the desired results by the breeder. Correlation studies seek to understand the relation that such characteristics present among themselves, which may result in the potentiation of the genetic gain in later generations, or to choose a material of interest (Borges et al., 2011).
However, correlation studies typically estimate the connection between variables in pairs regardless of their causes. Therefore, studies presenting more details about such relations among characteristics are fundamental, such as path analysis, developed by Wright (1921), which allows a better analysis of correlation coefficients in direct and indirect effects on an evaluated trait, with the variables previously standardized (Oliveira et al., 2011).
Thus, the objective of this study was to evaluate the correlation among the variables analyzed to select Capsicum genotypes resistant to the fungus C. gloeosporioides.
Materials and Methods
Experiment conditions
The study was conducted at Universidade do Estado de Mato Grosso (UNEMAT), in the city of Cáceres, Mato Grosso (MT) State. According to the Köppen classification, the area has a hot and humid tropical climate, with a dry winter (Awa), a rainy period of 4 months, and a dry season of 8 months, with an average annual temperature of 26°C (Neves et al., 2011). The accessions were collected from several farms in the southwestern region of the MT State, and the seeds were stored in the Germplasm Active Bank of the Plant Breeding Laboratory (LMGV) in a refrigerator at ±3°C.
The cultivation of pepper plants was conducted in a randomized block design with three replications and two plants per replication. Initially, the production of Capsicum sp seedlings was performed in a protected environment. After 45 days, the seeds were planted in beds with a spacing of 0.8 m between plants and 1.2 m between rows. Cultural treatments were performed as recommended for the culture according to Filgueira (2013). The irrigation system was set by dripping, and automatically compensate drops were used.
Evaluation of resistance of Capsicum fruits to C. gloeosporioides
Ripe and unripe fruits were harvested from each plot 50 days after anthesis, taken to the LMGV for disinfestation in 70% alcohol and sodium hypochlorite (0.5%), and rinsed in sterile distilled water for 1 min during each step. After disinfection, the fruits were packed in polystyrene trays covered with a transparent plastic bag containing pieces of moistened filter paper inside to establish a wet room. Eighty-eight accessions of Capsicum spp (Table S1)
were evaluated for resistance to the fungus C. gloeosporioides in a completely randomized experimental block design with three replications, with four unripe fruits, and four ripe fruits per replication.
To prepare the inoculation, the fungus C. gloeosporioides was grown in a PDA culture medium (potato dextrose agar) and kept in BOD with a photoperiod of 12 h at 24°C for 7 days. After this period, the spore suspension was adjusted to 106 conidia/mL using a mirrored Neubauer chamber.
The inoculation was made by a lesion in the middle region of each fruit using a sterile needle, followed by fungus inoculation by depositing a droplet containing 20 μL of the spore suspension in three ripe fruits and three unripe fruits. The control comprised the deposition of 20 μL sterile distilled water into one unripe fruit and one ripe fruit from each plot.
The trays were in an environment with controlled temperature and photoperiod of approximately 24°C and 12 h, respectively, for 13 days. The following variables (Maracahipes et al., 2016) were daily monitored to evaluate the resistance of Capsicum fruits to C. gloeosporioides: a) Incubation period (IP) - the period from the inoculation of the pathogen until the onset of the symptoms in the fruit. b) Latent period (LP) - the period from the inoculation of the pathogen until the appearance of the first reproduction structures. c) Days until lesion reaches 50% of the fruit length (DULR50L) - number corresponding to the number of days the lesion took to reach 50% of the fruit within the evaluation period of 11 days. d) Days until lesion reaches 50% of the fruit diameter (DULR50D) - number corresponding to the number of days the lesion took to reach 50% of the fruit diameter within the evaluation period of 11 days. e) Lesion diameter 7 days after inoculation (LD7) - diameter of the lesion of each fruit in each replication at the seventh day of evaluation. f) Lesion length 7 days after the inoculation (LL7) - length of the lesion of each fruit in each replication at the seventh day of evaluation. g) Lesion diameter ratio (LDR): (lesion diameter x 100) / fruit diameter. h) Lesion length ratio (LLR): (lesion length x 100) / fruit length. i) Area under the disease progress curve (AUDPC) - the area was calculated for each evaluation date for each fruit analyzed following the formula: (*diameter*length) / 4. Then, the AUDPC was calculated using the formula of Shaner and Finney (1977), determining a mean for each replication.
Statistical analyses
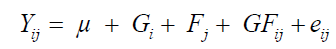
Initially, an analysis of variance was performed for each variable according to the mixed linear model in Equation 1:
 (Equation 1)
where Yij evaluates the i-th genotype at the j-th fruit stage; μ is the overall experiment mean; Fj is the fixed effect of the j-th fruit stage; Gi is the random effect of the i-th genotype; GFij is the random effect of the interaction between genotypes x fruit stages; and eij is the random error associated with the observation Yij.
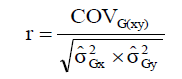
The genotypic correlations (r) between pairs of variables were estimated by Equation 2:
 (Equation 2)
where COVG(xy) is the genotypic covariance between the characters X and  i s the genotypic variance of the variable X; and
 s the genotypic variance of the variable Y. The genotypic correlations were tested by the Mantel test with 5000 simulations.
To graphically express the functional relationship between the estimates of the coefficients of genetic correlations among variables, the correlation network was used, where the proximity of nodes (traits) is proportional to the absolute value of the correlation between these nodes. Only |rij| ≥ 0.60 has its emphasis on edges: the positive correlations are highlighted in green, the negative correlations are represented in red.
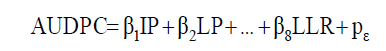
Then, the diagnosis of multicollinearity of the X’X correlation matrix was performed according to the classification of Montgomery and Peck (2001). The path analysis, considering the AUDPC as the primary dependent variable for each fruit stage, was performed according to the model described in Equation 3:
 (Equation 3)
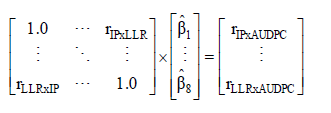
where β1, β2, ..., β7 are the estimators of the direct effects of the variables IP, LP, DULR50D, DULR50L, LD7, LL7, LDR, and LLR on AUDPC; and ε p i s the residual effect of the analysis. Thus, the normal equation system was used to estimate the direct and indirect effects of each explanatory variable on the AUDPC according to Equation 4:
 (Equation 4)
For each path analysis, the coefficient of determination (R2) and the residual effect  were obtained by the Equations 5 and 6, respectively:
 (Equation 5)
 (Equation 2)
All statistical analyses were performed using the GENE free software (Cruz, 2013) and R (R Core Team, 2015) with the help of the packages “lme4” and “qgraph”, and followed the procedures recommended by Cruz et al. (2012).
Results and Discussion
Model adjustment and genotypic correlations
It is possible to observe in Table 1 that the effects of genotypes (G), fruit stage (F) and their interaction (G x F) were significant (P < 0.05) according to the likelihood-ratio test for all variables. The inclusion of these effects in the full model provided the lowest values according to the Akaike and Bayesian information criterion when the reduced models were compared. These results indicate that there is a differential response of genotypes in function of fruit stage for all traits evaluated. Therefore, the genetic correlations were estimated between the pairs of variables for each fruit stage (green and ripe). The path analysis was performed in function of them.
| Trait | Effect | AIC | BIC | LRT |
|---|---|---|---|---|
| IP | Genotype (G) | 1221.9 | 1234.4 | 314.6* |
| Fruit stage (F) | 1448.4 | 1460.9 | 88.1* | |
| G x F | 1175.3 | 1187.8 | 45.1* | |
| Full model | 1137.8 | 1158.6 | - | |
| LP | Genotype (G) | 1393.0 | 1405.5 | 31.7* |
| Fruit stage (F) | 1609.3 | 1621.8 | 248.0* | |
| G x F | 1384.3 | 1396.8 | 23.0* | |
| Full model | 1353.0 | 1373.8 | - | |
| DULR50D | Genotype (G) | 2194.8 | 2207.3 | 258.5* |
| Fruit stage (F) | 2248.8 | 2261.3 | 312.5* | |
| G x F | 1950.2 | 1962.6 | 13.9* | |
| Full model | 1940.3 | 1961.1 | - | |
| DURD50L | Genotype (G) | 2780.3 | 2792.8 | 274.8* |
| Fruit stage (F) | 2846.0 | 2858.5 | 340.5* | |
| G x F | 2520.7 | 2533.2 | 15.2* | |
| Full model | 2509.5 | 2530.4 | - | |
| LD7 | Genotype (G) | 2446.4 | 2458.9 | 169.2* |
| Fruit stage (F) | 2559.4 | 2571.9 | 282.2* | |
| G x F | 2305.1 | 2317.6 | 27.9* | |
| Full model | 2281.2 | 2302.0 | - | |
| LL7 | Genotype (G) | 2831.8 | 2844.3 | 182.0* |
| Fruit stage (F) | 2968.9 | 2981.4 | 319.1* | |
| G x F | 2664.0 | 2676.5 | 14.2* | |
| Full model | 2653.8 | 2674.6 | - | |
| LDR | Genotype (G) | 3513.5 | 3526.0 | 30.0* |
| Fruit stage (F) | 3599.4 | 3611.9 | 86.2* | |
| G x F | 3547.0 | 3559.5 | 33.8* | |
| Full model | 3517.2 | 3538.1 | - | |
| LLR | Genotype (G) | 3899.3 | 3911.8 | 24.8* |
| Fruit stage (F) | 4244.8 | 4257.3 | 370.3* | |
| G x F | 3953.5 | 3966.0 | 79.0* | |
| Full model | 3878.5 | 3899.3 | - | |
| AUDPC | Genotype (G) | 7312.4 | 7324.9 | 67.2* |
| Fruit stage (F) | 7727.6 | 7740.1 | 482.4* | |
| G x F | 7326.2 | 7338.7 | 81.0* | |
| Full model | 7249.2 | 7270.0 | - |
*Significant at 1% probability by the chi-square test; IP: incubation period; LP: latent period; DULR50D: days until lesion reaches 50% of the diameter; DULR50L: days until lesion reaches 50% of the length; LD7: lesion diameter 7 days after the inoculation; LL7: lesion length 7 days after the inoculation; LDR: lesion diameter ratio; LLR: lesion length ratio; AUDPC - area under the disease progress curve.
Table 1. Akaike (AIC) and Bayesian (BIC) information criterion and likelihood-ratio test (LRT) of the effects tested for nine variables evaluated in fruits of 88 Capsicum sp accessions.
Table 2 shows estimates of the correlations between vectors of genetic values predicted by BLUP for fruits at the green (lower diagonal) and ripe (upper diagonal) stages. It is possible to verify that there were differences between the magnitudes of genotypic correlations according to fruit stage, with a high magnitude between the variables IP x LP and LL7 x LD7 at the two stages. The variable AUDPC correlated positively with the variable LL7 when fruits were at the green stage, but, at the ripe stage, this correlation had a low magnitude. For the ripe stage, the variables DULRD and DULRL correlated positively with AUDPC. As AUDPC is one of the most important variables in the selection of Capsicum sp genotypes, as for reaction to the fungus C. gloeosporioides, these results indicate that different variables should be taken into account for the indirect selection in this culture in function of fruit stage.
| Trait | IP | LP | DULRD | DULRL | LD7 | LL7 | LDR | LLR | AUDPC |
|---|---|---|---|---|---|---|---|---|---|
| IP | - | 0.882* | -0.484 | -0.537* | 0.245 | 0.285 | -0.089 | -0.181 | -0.484 |
| LP | 0.838* | - | -0.388 | -0.428 | 0.159 | 0.190 | -0.025 | -0.092 | -0.350 |
| DULRD | 0.065 | 0.177 | - | 0.762* | -0.544* | -0.458 | 0.070 | 0.199 | 0.713* |
| DULRL | 0.113 | 0.139 | 0.316 | - | -0.490 | -0.374 | 0.129 | 0.215 | 0.784* |
| LD7 | -0.446 | -0.298 | -0.037 | -0.057 | - | 0.756* | 0.100 | -0.087 | -0.366 |
| LL7 | -0.347 | -0.231 | -0.275 | 0.023 | 0.650* | - | 0.129 | -0.233 | -0.272 |
| LDR | -0.152 | -0.040 | -0.314 | 0.030 | 0.203 | 0.349 | - | 0.479 | 0.247 |
| LLR | -0.267 | -0.242 | -0.144 | -0.090 | 0.256 | 0.300 | 0.459 | - | 0.247 |
| AUDPC | -0.346 | -0.197 | 0.256 | 0.026 | 0.491 | 0.546* | 0.033 | 0.238 | - |
*Significant at 5% probability by the Mantel test based on 5000 simulations.
Table 2. Genotypic correlations between the variables incubation period (IP), latent period (LP), days until lesion reaches 50% of the diameter (DULR50D), days until lesion reaches 50% of the length (DULR50L), lesion diameter 7 days after the inoculation (LD7), lesion length 7 days after the inoculation (LL7), lesion diameter ratio (LDR), lesion length ratio (LLR), and area under the disease progress curve (AUDPC) evaluated in fruits of 88 Capsicum sp accessions at the green (diagonal lower) and ripe (upper diagonal) stages.
Figures 1 and 2 express a graphical representation of the variables according to the magnitudes of the genetic correlations among the variables in fruits at the green and ripe stages, respectively. Variables with high correlations are closer and linked by more expressive traits. The efficiency of this innovative technology has already been reported in studies on tomato (Ursem et al., 2008; DiLeo et al., 2011) and pepper (Silva et al., 2016). Correlation networks facilitate the interpretation of correlations between traits, thus making it easier to observe which traits can be used for an indirect selection when it is favorable.

Figure 1: Correlation network between the variables incubation period (IP), latent period (LP), days until lesion reaches 50% of the diameter (DULR50D), days until lesion reaches 50% of the length (DULR50L), lesion diameter 7 days after the inoculation (LD7), lesion length 7 days after the inoculation (LL7), lesion diameter ratio (LDR), lesion length ratio (LLR), and area under the disease progress curve (AUDPC) evaluated in fruits of 88 Capsicum sp accessions at the green stage.

Figure 2: Correlation network between the variables incubation period (IP), latent period (LP), days until lesion reaches 50% of the diameter (DULR50D), days until lesion reaches 50% of the length (DULR50L), lesion diameter 7 days after the inoculation (LD7), lesion length 7 days after the inoculation (LL7), lesion diameter ratio (LDR), lesion length ratio (LLR), and area under the disease progress curve (AUDPC) evaluated in fruits of 88 Capsicum sp accessions at the ripe stage.
Despite the magnitude of the correlations being changed in function of fruit stage, it is possible to verify that the variables LLR and LDR are farther apart from the other variables measured. Thus, for future studies, these variables may not be evaluated, which may reflect a lesser demand of time and hand labor to conduct experiments of this nature.
Although important, the genotypic correlation coefficient may give rise to misconceptions about the relationship between two variables. It may not be an actual measure of cause and effect. A high or a low estimate may be the result of the effect that a third variable or a group of variables exerts on a pair, thus not giving the exact relative importance of the direct and indirect effects of these factors (Cruz et al., 2012). Therefore, the path analysis was performed. It investigates the cause and effect relationship between explanatory variables and the main dependent variable (AUDPC).
However, to accurately obtain the direct and indirect effects in a path analysis, it is necessary the good conditioning of the X’X matrix. Under multicollinearity, direct and indirect effects may assume values higher than the parameter space of the path coefficients, making them unreliable (Cruz et al., 2012). According to the criteria presented by Montgomery and Peck (2001), the matrix of estimates of genetic correlations showed a weak multicollinearity for both path analyses because the condition number was less than 100. Therefore, all variables were used in the path analysis for unripe and ripe fruits of Capsicum spp.
According to the path analysis for fruits at the green stage (Table 3), it was found that the variables DULRD and DULRL exerted the greatest effects on AUDPC. These variables also present genotypic correlations with a high magnitude with AUDPC in the same direction of these effects, which translates into a cause and effect relation. Furthermore, these variables exert indirect effects on other variables such as IP, LD7, and LL7. The variable IP directly affects AUDPC with a moderate magnitude and may also be used for indirect selection because it presents genetic correlations in the same direction, besides ease of measurement.
| Effect | IP | LP | DULRD | DULRL | LD7 | LL7 | LDR | LLR |
|---|---|---|---|---|---|---|---|---|
| Direct on AUDPC | -0.220 | 0.175 | 0.306 | 0.525 | 0.026 | 0.058 | 0.132 | 0.002 |
| Indirect by IP | - | -0.194 | 0.106 | 0.118 | -0.054 | -0.063 | 0.020 | 0.040 |
| Indirect by LP | 0.155 | - | -0.068 | -0.075 | 0.028 | 0.033 | -0.004 | -0.016 |
| Indirect by DULRD | -0.148 | -0.119 | - | 0.234 | -0.167 | -0.140 | 0.021 | 0.061 |
| Indirect by DULRL | -0.282 | -0.225 | 0.400 | - | -0.257 | -0.196 | 0.068 | 0.113 |
| Indirect by LD7 | 0.006 | 0.004 | -0.014 | -0.013 | - | 0.020 | 0.003 | -0.002 |
| Indirect by LL7 | 0.016 | 0.011 | -0.026 | -0.022 | 0.044 | - | 0.007 | -0.013 |
| Indirect by LDR | -0.012 | -0.003 | 0.009 | 0.017 | 0.013 | 0.017 | - | 0.063 |
| Indirect by LLR | 0.000 | 0.000 | 0.000 | 0.000 | 0.000 | -0.001 | 0.001 | - |
| Indirect by IP | -0.484 | -0.350 | 0.714 | 0.784 | -0.367 | -0.272 | 0.247 | 0.247 |
| Coefficient of determination = 0.683 | ||||||||
| Effect of the residual variable = 0.563 |
Table 3. Direct and indirect effects of the variables incubation period (IP), latent period (LP), days until lesion reaches 50% of the diameter (DULR50D), days until lesion reaches 50% of the length (DULR50L), lesion diameter 7 days after the inoculation (LD7), lesion length 7 days after the inoculation (LL7), lesion diameter ratio (LDR), lesion length ratio (LLR) on the area under the disease progress curve (AUDPC) evaluated in fruits of 88 Capsicum sp accessions at the green stage.
The identification of the characters that present high genetic correlations and exert a high direct effect, in the same direction, on the main trait is desirable because the response correlated by indirect selection can be effective. However, it is important to mention that the variables DULRD and DULRL present a positive genotypic correlation with a high magnitude (0.762), and both present a negative correlation with a low magnitude with IP. This indicates that the indirect selection of genotypes with a high IP and low DULRD and DULRL provides a decrease in AUDPC.
For the path analysis performed on ripe fruits (Table 4), it was observed that the variables LL7 and DULRD exerted the greatest direct effects on AUDPC. However, it is important to consider that the genotypic correlation between DULRD and AUDPC was of low magnitude, indicating that the indirect selection via DULRD may not be effective, mainly due to the indirect effect of LL7 by DULRD. Therefore, only the influence of LL7 can be considered a cause and effect relation for AUDPC.
| Effect | IP | LP | DULRD | DULRL | LD7 | LL7 | LDR | LLR |
|---|---|---|---|---|---|---|---|---|
| Direct on AUDPC | -0.172 | 0.062 | 0.430 | -0.095 | 0.048 | 0.597 | -0.130 | 0.129 |
| Indirect by IP | - | -0.144 | -0.011 | -0.019 | 0.077 | 0.060 | 0.026 | 0.046 |
| Indirect by LP | 0.052 | - | 0.011 | 0.009 | -0.019 | -0.014 | -0.002 | -0.015 |
| Indirect by DULRD | 0.028 | 0.076 | - | 0.136 | -0.016 | -0.119 | -0.135 | -0.062 |
| Indirect by DULRL | -0.011 | -0.013 | -0.030 | - | 0.005 | -0.002 | -0.003 | 0.009 |
| Indirect by LD7 | -0.022 | -0.014 | -0.002 | -0.003 | - | 0.031 | 0.010 | 0.012 |
| Indirect by LL7 | -0.207 | -0.138 | -0.164 | 0.014 | 0.388 | - | 0.208 | 0.179 |
| Indirect by LDR | 0.020 | 0.005 | 0.041 | -0.004 | -0.026 | -0.045 | - | -0.060 |
| Indirect by LLR | -0.035 | -0.031 | -0.019 | -0.012 | 0.033 | 0.039 | 0.059 | - |
| Indirect by IP | -0.346 | -0.198 | 0.256 | 0.026 | 0.491 | 0.546 | 0.033 | 0.238 |
| Coefficient of determination = 0.685 | ||||||||
| Effect of the residual variable = 0.531 |
Table 4. Direct and indirect effects of the variables incubation period (IP), latent period (LP), days until lesion reaches 50% of the diameter (DULR50D), days until lesion reaches 50% of the length (DULR50L), lesion diameter 7 days after the inoculation (LD7), lesion length 7 days after the inoculation (LL7), lesion diameter ratio (LDR), lesion length ratio (LLR) on the area under the disease progress curve (AUDPC) evaluated in fruits of 88 Capsicum sp accessions at the ripe stage.
The variable AUDPC is an important criterion for selecting Capsicum sp accessions with a greater resistance to the fungus C. gloeosporioides. The standard estimator of AUDPC comprises the equation developed by Shaner and Finney (1977) using the trapezoidal rule for calculation and considering the information from multiple severity evaluations providing a single estimate. Thus, the evaluation of this variable represents a considerable investment of time, space, and economic and human resources. The identification of the auxiliary variables that have a cause and effect relationship with this variable is a promising strategy to improve a breeding program of Capsicum spp from UNEMAT, as it will provide savings in hand labor and financial resources in future research. However, it is important to consider that the estimates of the coefficients of determination obtained at the two ripening stages showed moderate magnitudes. Although higher than the residual effect, it indicates that other variables should be measured in future studies.
Acknowledgments
We thank the funding agencies CNPq, CAPES, and FAPEMAT for the financing of this study and the scholarship.
About the Authors
Corresponding Author
A.C. Maracahipes
Departamento de Melhoramento de Plantas, Universidade Estadual do Norte Fluminense Darcy Ri, Campos dos Goytacazes, RJ, Brasil
- Email:
- alan.chrisleyr@outlook.com
References
- Borges V, Sobrinho FS, Lédo FJS and Kopp MM (2011). Associação entre caracteres e análise de trilha na seleção de progênies de meios-irmãos de Brachiaria ruziziensis. Rev. Ceres 58: 765-772. https://doi.org/10.1590/S0034- 737X2011000600013
- Costa LV, Lopes MTG, Lopes R and Alves SRM (2008). Polinização e fixação de frutos em Capsicum chinense Jacq. Acta Amazon. 38: 361-364. https://doi.org/10.1590/S0044-59672008000200022
- Cruz CD (2013). GENES - a software package for analysis in experimental statistics and quantitative genetics. Acta Sci. Agron. 35: 271-276. https://doi.org/10.4025/actasciagron.v35i3.21251
- Cruz CD, Regazzi AJ and Carneiro PCS (2012). Modelos biométricos aplicados ao melhoramento genético. 3rd edn. Editora UFV, Viçosa.
- Da Silva AR, Rêgo ER and Cecon PR (2011). Tamanho de amostra para caracterização morfológica de frutos de pimenteira. Hortic. Bras. 29: 125-129. https://doi.org/10.1590/S0102-05362011000100022
- DiLeo MV, Strahan GD, den Bakker M and Hoekenga OA (2011). Weighted correlation network analysis (WGCNA) applied to the tomato fruit metabolome. PLoS One 6: e26683. https://doi.org/10.1371/journal.pone.0026683
- Filgueira FAR (2013). Parte II - Olericultura especial. In: Novo manual de olericultura: agrotecnologia moderna na produção e comercialização de hortaliças (Filgueira FAR, ed.). 3rd edn. UFV, Viçosa.
- França GS, Costa-Carvalho RR, Neves RP, Araujo ER, et al. (2015). Controle pós-colheita da antracnose do pimentão pela levedura Rhodotorula glutinis. Biosci. J. 31: 451-459. https://doi.org/10.14393/BJ-v31n2a2015-22387
- Maracahipes AC, Viscovini KKCG, da Silva Annunciatto E, Neves LG, et al. (2016). Genetic diversity of the germplasm active bank of Capsicum of UNEMAT based on components resistant to the fungus Colletotrichum gloeosporioides. Aust. J. Crop Sci. 10: 940-948. https://doi.org/10.21475/ajcs.2016.10.07.p7437
- Montgomery DC and Peck EA (2001). Introduction to linear regression analysis. 3rd edn. John Wiley & Sons, New York.
- Moscone EA, Scaldaferro MA, Grabiele M, Cecchini NM, et al. (2007). The Evolution of Chili Peppers (Capsicum - Solanaceae): a Cytogenetic Perspective. Acta Hortic. 745: 137-169. https://doi.org/10.17660/ActaHortic.2007.745.5
- Neves SMA, Nunes MCM and Neves NJ (2011). Caracterização das condições climáticas de Cáceres/ MT-Brasil, no período de 1971 a 2009: subsídio às atividades agropecuárias e turísticas municipais. Bol. Goia. Geogr. 31: 55-68.
- Oliveira EJ, de Lima DS, Lucena RS, Motta TBN, et al. (2011). Correlações genéticas e análise de trilha para número de frutos comerciais por planta em mamoeiro. Pesqui. Agropecu. Bras. 45: 855-862. https://doi.org/10.1590/S0100- 204X2010000800011
- Pereira MJZ, Massola NS, Junior., Sussel AAB, Sala FC, et al. (2011). Reação de acessos de Capsicum e de progênies de cruzamentos interespecíficos a isolados de Colletotrichum acutatum. Hortic. Bras. 29: 569-576. https://doi. org/10.1590/S0102-05362011000400021
- R Core Team (2015). R: A Language and Environment for Statistical Computing. R Foundation for Statistical Computing, Vienna.
- Ranathunge NP, Mongkolporn O, Ford R and Taylor PWJ (2012). Colletotrichum truncatum pathosystem on Capsicum spp: infection, colonization and defence mechanisms. Australas. Plant Pathol. 41: 463-473. https://doi.org/10.1007/ s13313-012-0156-0
- Shaner G and Finney RE (1977). The effect of nitrogen fertilization on the expression of slow-mildewing resistance in knox wheat. Phytopathology 67: 1051-1056. https://doi.org/10.1094/Phyto-67-1051
- Silva ARD, Rêgo ERD, Pessoa AMDS and Rêgo MMD (2016). Correlation network analysis between phenotypic and genotypic traits of chili pepper. Pesqui. Agropecu. Bras. 51: 372-377. https://doi.org/10.1590/S0100- 204X2016000400010
- Ursem R, Tikunov Y, Bovy A and Van Berloo R (2008). A correlation network approach to metabolic data analysis for tomato fruits. Euphytica 161: 181-193. https://doi.org/10.1007/s10681-008-9672-y
- Wright S (1921). Correlation and causation. J. Agric. Res. 20: 557-585.
Keywords:
Download:
Full PDF- Share This