Adaptability and stability of soybean cultivars for grain yield and seed quality
Published: May 10, 2017
Genet.Mol.Res. 16(2): gmr16029646
DOI: 10.4238/gmr16029646
Abstract
This study aimed at verifying the adaptability and stability of soybean cultivars, considering the grain yield and quality of seeds, adopting univariate and multivariate approaches. The experiments were conducted in two crops, three environments, in 2013/2014 and 2014/2015 crop seasons, in the county of Inconfidentes, Lavras, and Patos de Minas, in the Minas Gerais State, Brazil. We evaluated 17 commercial soybean cultivars. For adaptability and stability evaluations, the Graphic and GGE biplot methods were employed. Previously, a selection index was estimated based on the sum of the standardized variables (Z index). The data relative to grain yield, mass of one thousand grain, uniformity test (sieve retention), and germination test were standardized (Zij) per cultivar. With the sum of Zij, we obtained the selection index for the four traits evaluated together. In the Graphic method evaluation, cultivars NA 7200 RR and CD 2737 RR presented the highest values for selection index Z. By the GGE biplot method, we verified that cultivar NA 7200 RR presented greater stability in both univariate evaluations, for grain yield, and for selection index Z.
Introduction
Soybean grain yield in Brazil, in 2015/16, presented a growth area encompassing 33,176.9 thousand/ha, with average grain yield of 2882 kg/ha (Conab, 2016). Minas Gerais State has been prominent in the soybean crop production. It is the largest producer of the southeastern region. The 2015/16 crop season estimates an increment of 20.6% in a grain yield when compared to the previous one, reaching an average of 3206 kg/ha (Conab, 2016).
However, adverse weather, as temperature or irregularity in rain distribution, causing the so-called “short mini-droughts”, is one of the factors that compromise the good development of soybean culture. This factor together with the intrinsic characteristics of genotype x environment interaction (G x E) culminate in phenotype expression. Breeders through plant breeding seek to mitigate the effect of this interaction in the development of adapted and stable cultivars for various regions and climate conditions (Amira et al., 2013).
Seed quality is one of the important aspects in the search for an elevated grain or seed production, given that quality directly interferes over culture development. Therefore, seeds with an elevated degree of quality provide uniform stands, with the absence of seed-transmitted diseases, resulting in high vigor plants (França-Neto et al., 2014). Soybean seeds are very sensitive to environmental factors. It is known that the region of cultivation influences the physiological quality of the seed due to oscillations in temperature and moisture conditions during plant maturation (Gomes et al., 2012). These environmental variations trigger distinct interactions between the cultivars and the cultivation environment (Meotti et al., 2012). The selection of more adapted cultivars, with good stability, quality assurance and technologies for different regions, and edaphoclimatic conditions provide production and grain yield gain for the crop. Research associate production and seed quality to soybean represent important gain for the cultivars selection and recommendation; however, there are few studies about it and no reports of research for the Minas Gerais State. The objective of this study was to verify the adaptability and stability of soybean cultivars considering the production and seed quality.
Materials and Methods
The experiments were carried out in two crop years, the 2013-2014 and 2014-2015 crop seasons, in three distinct locations in the Minas Gerais State. a) At the Instituto Federal de Educação, Ciência e Tecnologia de Minas Gerais, Inconfidentes campus, in experimental farm located at 869 m in altitude, 22°19'01''S and 46°19'40''W. The soil was classified as Eutrophic Red-Yellow Oxisol, of clayey texture. b) At the experimental farm situated in the Centro de Desenvolvimento Científico e Tecnológico em Agropecuária - Muquém, of Universidade Federal de Lavras - UFLA, located in the county of Lavras, at 918 m in altitude, 21°12'11''S and 44°58'47''W, in soil classified as typical Distroferric Red Oxisol - fRO, with clayey texture. c) At the EPAMIG experimental farm in Patos de Minas, located at 1074 m in altitude, 18°29'70''S and 46°26'55''W. The results of the soil analysis per environment are presented in Table 1, and the weather data are presented in Figure 1.

Figure 1: Month variations of precipitation and temperature in the period from October to April, under the experimental conditions in the evaluated counties. Source: Instituto Nacional de Meteorologia - INMET (2016).
| Chemical properties | Environments | |||||||
|---|---|---|---|---|---|---|---|---|
| Inconfidentes | Lavras | Patos de Minas | ||||||
| Env. 1 | Env. 2 | Env. 3 | Env. 4 | Env. 5 | Env. 6 | |||
| pH | H2O | 5.7 | 5.98 | 6.4 | 5.7 | 5.4 | 5.8 | |
| Ca2+ | cmolc/dm3 | 6.1 | 2.98 | 5.0 | 3.3 | 1.3 | 2.0 | |
| Mg2+ | 1.4 | 0.67 | 1.4 | 0.6 | 0.5 | 0.9 | ||
| Al3+ | 0 | 0 | 0 | 0.2 | 0.5 | 0.1 | ||
| H++Al3+ | 4.3 | 2.86 | 2.9 | 4.0 | 7.9 | 4.0 | ||
| SB | 7.7 | 3.96 | 6.7 | 4.2 | 1.9 | 3.0 | ||
| P | mg/dm3 | 20.3 | 41.84 | 11.4 | 24.6 | 16.0 | 43.8 | |
| K | 70.1 | 121.6 | 118.0 | 116.0 | 56.0 | 36.0 | ||
| Zn2+ | 3.17 | 5.62 | 4.9 | 2.6 | 3.18 | 2.2 | ||
| Mn2+ | 5.9 | 8.4 | 31.7 | 20.6 | 3.99 | 3.1 | ||
| Cu2+ | 0.34 | 0.01 | 1.4 | 0.08 | 1.1 | 0.8 | ||
| B | 0.001 | 0 | 0.17 | 0.2 | 0.19 | 0.1 | ||
| Fe2+ | 20.8 | 25.6 | 34.8 | 54.3 | 33.3 | 35.0 | ||
| S | - | - | 4.7 | 9.0 | 15.05 | 10.1 | ||
| OM | dag/kg | 4.14 | 3.45 | 3.4 | 2.2 | 4.14 | 3.0 | |
| V | (%) | 64.2 | 58.03 | 69.8 | 83.5 | 19.8 | 42.8 | |
Env. 1: 2013/14 crop season; Env. 2: 2014/15 crop season; Env. 3: 2013/14 crop season; Env. 4: 2014/15 crop season; Env. 5: 2013/14 crop season; Env. 6: 2014/15 crop season.
Table 1. Chemical characteristics of the soils in the studied environments, 2013/2014 and 2014/2015 crop seasons.
In each environment, i.e., crop seasons and locations, 17 commercial soybean cultivars from different companies were evaluated (Table 2).
| Cultivar | Origin | R.M. | G.H. | Information |
|---|---|---|---|---|
| 1- TMG 123 RR | Tropical Melhoramento and Genética | 7.4 | Determined | Resistance: to rain at harvest, to cyst |
| 2- TMG 1176 RR | 7.6 | Determined | Resistance: to cyst | |
| 3- TMG 1179 RR | 7.9 | Determined | Resistance: to cyst | |
| 4- TMG 1181 RR | 8.1 | Determined | Resistance: to cyst | |
| 5- BRSMG 760 SRR | EMBRAPA | 7.6 | Indeterminate | Resistance: stem canker, bacterial pustule, frogeye leaf spot |
| 6- BRSMG 780F RR | 7.8 | Determined | Resistance: moderate to Asian rust | |
| 7- CD 250 RR | COODETEC | 5.5 | Indeterminate | Resistance: stem canker, bacterial pustule, frogeye leaf spot |
| 8- CD 2737 RR | 7.3 | Indeterminate | Resistance: cyst nematodes, races 3 and 14 | |
| 9- CD 237 RR | 8.1 | Determined | Resistance: gall forming nematodes and race 3 cyst | |
| 10- BMX Potência | BRASMAX | 7.0 | Indeterminate | Resistance: root rot of Phytophthora, races 1 and 4 |
| 11- BMX Força | 6.2 | Indeterminate | Resistance: root rot of Phytophthora, races 1 and 3 | |
| 12- NA 5909 RG | Nidera | 6.1 | Indeterminate | - |
| 13- NA 7200 RR | 7.2 | Indeterminate | - | |
| 14- NS 7100 RR | 7.1 | Indeterminate | Resistance: moderate to water deficit | |
| 15- V-MAX RR | Syngenta | 6.2 | Indeterminate | Resistance: to cyst, races 1 and 3 |
| 16- P 98Y11 RR | Du Pont Pioneer | 8.1 | Determined | Resistance: to cyst, races 1 and 3 |
| 17- Monsoy 7211 | Monsoy | 7.2 | Indeterminate | Resistance: lodging |
R.M.: relative maturity. G.H.: growth habit.
Table 2. Cultivars used in the experiments in the 2013/2014 and 2014/2015 crop seasons.
A completely randomized block experimental design was adopted, with three replicates. Each experimental plot consisted of four 5.0-m length rows, spaced at 0.50 m, using the two center rows as a useful area, with elimination of 0.50 m at their extremities.
The experiments were set up in an area under a no-tillage system, for 10 years in a soybean/maize rotation. Desiccation was performed 10 days before sowing. Fertilization followed the recommendations of Souza and Lobato (2004) was performed at the planting groove, with 350 kg/ha of the commercial formula N-P2O5-K2O (02-30-20) being applied in the planting furrow. Inoculation was performed in the groove after sowing, using the Nitral peat-based inoculant (Bradyrhizobium japonicum), with the aid of a motorized pulverizer, applying six times the recommended dose, in the proportion of 1,200,000 bacteria per seed, in the dose of 4 mL/kg seeds.
Sowing was conducted manually with a density of 12 seeds per meter and the thinning was performed at 25 days after germination. The other crop treatments were employed according to the premises for cultures in the region.
For the purposes of evaluation, data were obtained of grain yield in kg/ha, and at the time of harvest the following were assessed: lodging rate, evaluated according to Bernard et al. (1965) with the following scores: 1 - for all upright plants, 2 - for some plants leaning or slightly lodged, 3 - for all plants moderately leaning or 25-50% lodged, 4 - for all the plants severely leaning or 50-80% lodged, and 5 - for more than 80% lodged plants; plant height (distance from the root collar up to the extremity of the main stem, in centimeters, measured in 5 random plants); and height of the lowest pod (distance from the root collar of the plant up to the node of the first pod, in centimeters, of 5 random plants). Subsequently, we conducted the mass of one thousand grain test, with eight replicates of 100 grains, calculated according to Brasil (2009), with the result obtained in grams; uniformity test (sieve retention), in which the sieve indicated for the cultivar was determined by means of percentage of seeds retained in the sieve (Brasil (2009)); and the germination test in Germitest paper, conducted according to criteria established in the Rules for Seed Analysis (Brasil (2009)).
Individual analyses of variance evaluated per trait were carried out adopting a procedure similar to that presented by Ramalho et al. (2012). Before the joint analyses, the error variance homogeneity test was performed (Hartley test). Subsequently, the R2 calculation was obtained by means of the difference between the square sum of the interactions and the difference of the total square sum of the residue, to evaluate the contribution of the factor for total variance (Ramalho et al., 2012). With the phenotypic measurements, the joint analyses were carried out per location, also adopting the procedure developed by Ramalho et al. (2012). All statistical analyses were carried out through the R program. The phenotypic mean values were clustered using the Scott and Knott (1974) procedure at 5% probability.
Once determined the presence of the G x E interaction (significant F-test), we proceeded to the calculation of Z index, denominated the sum of standardized variables (Mendes et al., 2009).
The observations relative to grain yield, mass of one thousand grain, uniformity test (sieve retention), and germination test were standardized by cultivar, aiming at making them directly comparable. Standardized variable Zij was obtained by the following estimator: Zij = (yij - �?³.j) / sj, in which Zij is the value of the standardized variable of cultivars i (i = 1, 2, …, 17), in replicate j (j = 1, 2, 3); yij is the observation of the variable of cultivar i in replicate j; �?³.j is the general mean of the variable of the 17 cultivars, in replicate j, and sj is the phenotypic standard deviation of the variable of replicate j. After standardization of the variables, the sum  ,was obtained, corresponding to the sum of the four standardized variables. Variable
 was used as selection index (Z index), in which the values correspond to the index favorable to selection. Since Z index was obtained for each cultivar, it was possible to perform analysis of variance for the remaining evaluated traits. Then, the following methods were employeed: Graphic method (Nunes et al., 2005), for adaptability and stability study of the cultivars, and the GGE biplot method, which evaluates the effect of the genotype and of the G x E interaction (Yan et al., 2000).
The Graphic Method was employed, given that it is an analysis of easy visualization and data interpretation in experiments conducted in different environments. This method is based on the standardization of the means evaluated in the experiments conducted in different environments, according to the expression: 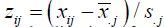 . In this study, zij is Z index, i.e., the sum of the variables standardized. Standardization of variables zij can assume positive and negative values, making for an easy graphic visualization with the addition of a constant. Thus, the values of zij because always positive. The standardization of the values for Z index was used for constructing a diagram for each cultivar. The dimensions of the axis (environments) are equivalent to the values of Z index for cultivar i (1, 2, …, 17) in environment j (1, 2, 3) (Nunes et al., 2005).
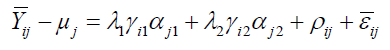
The presentation of the inter-relation between environments and genotypes was done by means of the GGE biplot method [genotype (G) and G x E interaction] developed by Yan et al. (2000). The analysis was performed according to that presented by Oliveira et al. (2010), considering the simplified model of two main components (Equation 1):
 (Equation 1)
where  is the first main component (PCA1), of the effect of G + G x E interaction;
 is the second main component (PCA2), of the effect of G + G x E interaction; λ1 and λ2 are the eigenvalues associated with PCA1 and PCA2; γi1 and γi2 are the scores of PCA1 and PCA2, respectively, for genotypes; αj1 and αj2 are scores of the PCA1 and PCA2, concomitantly, for environments;
  is the residue of the G x E interaction, correspondent to the main components not retained in the model; and
  is the residual of the model with normal distribution, with mean zero and variance σ2/r (in which σ2 is the variance of the error between plots for each environment, and r is the number of replicates).
Results and Discussion
The accuracy estimates reflect the precision with which the experiments were conducted, as well as the existence of variability, and if its value were above 70%, it is considered of great magnitude (Resende and Duarte, 2007). In this research, all evaluated characters presented values superior to 70% (Table 3).
| SV | d.f. | Pr > FC (R2)Yield | Pr > FC (R2)Lodg. | Pr > FC (R2)Hei. | Pr > FC (R2)Pod |
|---|---|---|---|---|---|
| Treatment (T) | 16 | 0.0000** - | 0.0000** - | 0.0000** - | 0.0000** - |
| Replicate | 12 | 0.0000** - | 0.0414** - | 0.0000** - | 0.0066** - |
| Location (L) | 2 | 0.0000** - | 0.0000** - | 0.0000** - | 0.0000** - |
| Year (Y) | 1 | 0.0000** - | 0.0000** - | 0.0000** - | 0.0000** - |
| T x L | 32 | 0.0003** (21%) | 0.0003** (10%) | 0.0006** (18%) | 0.0000** (12%) |
| T x Y | 16 | 0.0025** (9,3%) | 0.0000** (11%) | 0.0177* (25%) | 0.0017** (6%) |
| L x Y | 2 | 0.0000** (30%) | 0.0000** (15%) | 0.0000** (41%) | 0.0000** (13%) |
| T x L x Y | 32 | 0.2150 (30%) | 0.0000** (18%) | 0.1062 (42%) | 0.0083** (6%) |
| Error | 192 | - | - | - | - |
| General mean | - | 47 bags/ha | 1.37 | 85.88 | 13.94 |
| Accuracy (%) | - | 92.94 | 89.92 | 97.3 | 89.9 |
| VC (%) | - | 21.51 | 37.11 | 9.01 | 21.66 |
**Significant at 1% of probability, *significant at 5% of probability by the F-test. SV: source of variation. d.f.: degrees of freedom. Pr > FC: correction factor. Lodg.: loodging (score 1 to 5). Hei.: height (cm). Pod: height of the lowest pod (cm). VC: variation coefficient.
Table 3. Joint analysis of variance in the traits evaluated in field.
From the combined analysis of variance presented in Table 3, it can be observed that, in all three environments studied, there was significant difference (Pr > FC) for the characteristics of grain yield, lodging, plant height, and height of the lowest pod. Thus, these results show that there is wide variability between the cultivars.
The interaction between treatments and locations (T x L) was significant for grain yield and for the remaining production components evaluated. This corroborates that the performance of the cultivars was not coincident in the different locations, i.e., the genotypes used in this research presented inconsistent behavior in each environment, and presented variation in the magnitude of the responses for each grain yield traits, as well as for the production components in virtue of environmental variation (Table 3). The remaining interactions of treatment x year (T x Y) and location x year (L x Y) were also significant for the evaluated characteristics, confirming that the behavior of the evaluated genotypes differs in relation to the year of experiment implementation, and that there is variation in the magnitude of the responses of the evaluation of the L x Y interaction. This draws us to the need of experimenting in different location, crop years and ecological zoning for recommendation of cultivars.
In relation to the interaction magnitudes for grain yield, it can be observed that the interaction between treatment and location (T x L) was superior to that between treatment and year (T x Y). de Vasconcelos et al. (2015), aiming at evaluating grain yield, adaptability and phenotypic stability of soybean cultivars and lines of precocious and intermediate cycles, verified that the differential behavior of the genotypes in relation to the locations was also more pronounced than in relation to the crop years. In research focusing on the characterization of soybean genotypes resistant to red root rot disease, a significant difference of the T x L interaction in relation to T x Y was verified (Farias Neto et al., 2013). In literature, this fact can also be verified for other cultures, such as common bean (Phaseolus vulgaris) (Ribeiro et al., 2014), rice (Oryza sativa) (Regitano Neto et al., 2013) and wheat (Triticum aestivum) (Yan et al., 2002). However, this was not expected, given that the fluctuations that occurred from one year to the other are, in their majority, caused by unpredictable environmental factors (Allard and Bradshaw, 1964).
On the other hand, when considering lodging and plant height, we observe a higher magnitude of T x Y interaction when compared to the T x L interaction.
Table 4 presents the phenotypic means of the cultivars. There was ample variation in average grain yield. The amplitude of the variation was of 25 bags/ha. This can be considered quite expressive. For lodging, however, according to the classification adopted (Bernard et al., 1965) the cultivars framed in the same phenotype, not lodged plants.Concerning plant height, we also detected significant variation of 44 cm. The same was observed for the height of the lowest pod, with variation from 19.5 to 10.3 cm. Researches have been conducted in the region with the objective of selecting cultivars with good adaptability and stability, allied to good productive performance and agronomic characteristics (Rezende and Carvalho, 2007; Carvalho et al., 2010; Soares et al., 2015; Silva et al., 2015). The present study is in accordance with the literature. Furthermore, it associates the study in seed quality.
|
Cultivars | Grain yield (bags/ha) | Lodging (score) | Height (cm) | Pod (cm) |
|---|---|---|---|---|---|
|
TMG 1179 RR | 58a | 1.2c | 81.8d | 11.9c |
|
NA 7200 RR | 56a | 1.2c | 85.7c | 13.2c |
|
CD 2737 | 53a | 1.1c | 99.4b | 12.8c |
|
CD 237 | 52a | 1.6b | 80.6d | 13.4c |
|
P98Y11 RR | 51b | 1.5b | 81.1d | 15.9b |
|
BRSMG 760 RR | 50b | 1.2c | 104.9a | 15.2b |
|
BMX Potência | 49b | 1.1c | 85.1c | 13c |
|
BMX Força | 48b | 1.2c | 86c | 13.6c |
|
Monsoy 7211 | 48b | 1.8b | 107.3a | 15.9b |
|
TMG 1176 RR | 48b | 1.7b | 88.4c | 15.9b |
|
V-MAX RR | 47b | 1.2c | 78.9d | 12.7c |
|
BRSMG 780 RR | 46b | 1.6b | 97.2b | 19.5a |
|
NA 5909RG | 44b | 1.0c | 63.3f | 12.8c |
|
TMG 1181 RR | 43c | 1.8b | 83.3c | 12.9c |
|
TMG 123 | 38c | 2.3a | 84.2c | 16.2b |
|
CD 250 | 38c | 1.0c | 74c | 10.2c |
|
NS 7100 RR | 33c | 1.0c | 78.6d | 11.8c |
Mean values followed by the same letters belong to the same group by the Scott and Knott test at 5% probability.
Table 4. Phenotypic means of the cultivars for the traits of grain yield (bags of 60 kg/ha), lodging (score 1 to 5), plant height (cm), and height of the lowest pod (cm).
We verified that, for the tests mass of one thousand grain and germination test, the experimental precision, estimated by the variation coefficient (VC), was good. The same occurred for accuracy. These parameters evaluate the degree of precision of the experiments (Resende and Duarte, 2007; Pimentel-Gomes, 2009). In Table 5, a significant difference was detected for the sources of variation (SV), treatments (T), location (L) and year (Y) for all tests (P ≤ 0.01). For treatments, this difference was expected, given that, as mentioned, the cultivars are from different origins, thus the variation for agronomic traits (Soares et al., 2015) and soybean seed quality.
When analyzing interactions T x L and L x Y (Table 5), it can be verified that, for sieve yield (6.5 mm), all interactions presented significance lower than 1%. For the mass of one thousand grain, these interactions presented significance of 5%. For the germination test, all interactions presented statistical significance (Table 5). Gomes et al. (2012), when evaluating the physiological quality and yield of seeds of different soybean cultivars, concluded that the physiological quality and grain yield of the seeds were influenced by the growing environment.
The results indicate a statistical difference for the evaluated locations in all studied traits (Table 5). Furthermore, the effect of the environment over quality expression is also constantly verified in literature (Gomes et al., 2012; de Pádua et al., 2014; Frandoloso et al., 2015). The interaction T x L, for the test of the mass of one thousand grain, indicated that the responses regarding environmental variations were not coincident for the evaluated cultivars. This result was expected in virtue of the distinction of the locations in relation to the characteristics of latitude, longitude and altitude. In addition, the characteristics of natural fertility and soil physics were also diverging; observed a significant difference in soil base saturation (V%), this characteristic is directly related to the natural fertility of the soil that influence on the nutrition of plants and in production consequently. This difference occurred between the county and the crop seasons (Table 1).
The test of mass of one thousand grain is used to calculate sowing density and, then, estimate how much seeds will be used in function of density. In addition, we can infer over the size of the grain, as well as over its maturity and sanity (Brasil (2009)). In literature, it is reported that the specific mass of the seeds is strongly influenced by the edaphoclimatic conditions and chemical management of the soils (Batistella Filho et al., 2013).
For the phenotypic means of the trait sieve yield (6.5 mm), there was ample variation. Observe that cultivars V-MAX RR and BMX Força presented 50% of production in this class. On the other hand, cultivar TMG 1179 RR presented the worst performance. These results are directly with the mass of one thousand grain, since the greater the sieve yield (6.5 mm) is, the greater the mass of one thousand grain will be (Table 6).
In the germination test, only two genotypes obtained the minimum response demanded by MAPA (Ministério da Agricultura, Pecuária e Abastecimento) for the commercialization of soybean seeds, and for the commercialization of seed in Brazil, is of 80%, according to regulations of Secretaria de Estado da Agricultura e Abastecimento, in resolution number 051 of 1986 (Carraro and Peske, 2005), although a low variation has been verified for this characteristic for other cultivars. Soybean is a culture highly prone to deterioration, and is sensitive to environmental adversities, inadequate management at harvest, processing and storage during maturation (Marcos-Filho, 2013).
The occurrence of intermediate or low germination results in seedling weakened that hardly present field competitiveness. In a study with the objective of evaluating seed quality from soybean genotypes at different harvested periods, Xavier et al. (2015) concluded that the delay in harvest progressively reduces germination in all evaluated cultivars. One research, conducted with the objective of evaluating the variability between soybean plants within a population of seeds with different levels of physiologic quality, identified that seeds with low physiologic quality diminish the survival of plants in the field and increase the variability between plants in the community (Cantarelli et al., 2014). The alternate exposure to dry and humid environmental conditions at the post-maturation phase can cause damage by moisture, and can aggravate when under tropical conditions, since the climate is predominantly warm and humid, contributing to the acceleration of seed deterioration (Castro et al., 2016).
In plant breeding, it is common to work with many traits. In this study, we evaluated those attributed in the field and in the laboratory. In studies such as this, the soybean breeder is searching for lines that present the best attributes under both conditions. Thus, the use of selection indexes has been a good option for this type of research.
In this sense, the sum of the standardized variable method, Z index (Mendes et al., 2009), and the Graphic method (Nunes et al., 2005) were applied. In Figure 2, it is possible to observe that cultivars NA 7200 RR, V-MAX RR, CD 2737 RR, BMX Potência, and BMX Força presented good grain yield, uniformity (sieve yield - 6.5 mm), mass of one thousand grain and germination test. Cultivars NA 7200 RR and CD 2737 RR are within the group of highest grain yield cultivars evaluated in this study, in both crop seasons evaluated, according to Table 4. This strategy allows the identification of cultivars with good yield and physiological quality.

Figure 2: Representation of the Graphic method. The line represents the sum of the standardized grain yield, mass of one thousand grain, germination test, uniformity test (sieve retention - 6.5 mm). The numbers represent each environment (1: 2013/14 Inconfidentes; 2: 2014/15 Inconfidentes; 3: 2013/14 Lavras; 4: 2014/15 Lavras; 5: 2013/14 Patos de Minas; 6: 2014/15 Patos de Minas, associated with variable Z, and axis of each evaluated environment.
Literature presents many researches with different cultures based on selection index. For eucalyptus, this Z index allowed to graphically observe in which characteristics the progeny presented any deficiency (Reis et al., 2011). Also with eucalyptus, Reis et al. (2015) concluded that the sum of Z of the standardized variables is a good alternative for simultaneous selection of many characteristics in the forestry sector. For the common bean, elevated selection indices were found for attributes erect plants and smaller lodging (Mendes et al., 2009). Lima et al. (2012), using Z index for the common bean, observed that this index contributed, outstandingly, allowing the simultaneous identification of grain yield, architecture and G x E interaction. This also occurred in the corn culture, when selecting corn specific for popcorn and baby corn (DoVale et al., 2011), with sweet potato, associating attributes for human consumption, production of ethanol and animal feeding, reminding that the selection index is efficient in identifying aptitude in sweet potato genotypes (Gonçalves Neto et al., 2011).
In soybean crop, especially for breeding, different selection indexes are used. Costa et al. (2004) concluded that the gains obtained with the indexes were more adequate for the selection of superior genotypes for registering higher total gains of the evaluated characteristics. For soybean populations, evaluated seeking genetic gain for eleven traits of economic interest, higher selection gain was observed by the selection indexes, with advantages for the index based on sum of ranks (Bárbaro et al., 2007). It must be highlighted that literature lacks information that associate selection index Z with seed quality. Thus, researches that associate seed quality with agronomic attribute are of maximum relevance, so the information involving the agronomic characteristics with the seed quality will assist in the selection processes and recommendation for soybean cultivars.
The analysis of the GGE biplot was conducted in order to evaluate the adaptability and stability of the cultivars regarding grain yield and the sum of Z index. The partition of the interaction of genotypes and environment (IGE) revealed that the main components (PCA1 and PCA2) represent 80.1and 51.9% of the squares sum of the IGE of the grain yield mean and the sum of index Z, respectively. The values presented high to moderate reliability attributed to the explanation of total variation for the performance of the genotypes and its interaction with the environment (G + G x E). The first main component (PCA1) indicates the adaptability of the genotypes, thus being highly correlated with grain yield (Yan et al., 2000). In this sense, we can verify in the which won where approach, that cultivar 13 was the most adapted to the evaluation environments, followed by cultivars 3, 7, 11, and 8 (Figure 3A) for yield. On the other hand, when observing the Z index graphic, we verify that the most adapted cultivar would be cultivar 8, followed by cultivars 14 and 11. The second main component (PCA2), closest to zero would be the more stable genotypes (Yan et al., 2000). Therefore, cultivars 16, 4, 9, and 13, for grain yield, present higher stability (Figure 3A), and, for constant Z, the cultivars with highest stability are 7, 1, 17, 10, and 13 (Figure 3B). Analyzing both components of the graphic, we can infer that the best genotype for grain yield would be cultivar 13, considering adaptability and stability, given that it was most adapted and was among the most stable cultivars. Furthermore, verifying both components of the graphic for Z index, cultivar 13 stands out once more, being among the most adapted and stable cultivars.

Figure 3: Diagram of GGE biplot. A. Mean grain yield (kg/ha) and B. Z index. Env. 1: 2013/14 Inconfidentes; Env. 2: 2014/15 Inconfidentes; Env. 3: 2013/14 Lavras; Env. 4: 2014/15 Lavras; Env. 5: 2013/14 Patos de Minas; Env. 6: 2014/15 Patos de Minas.
The GGE biplot also presents an environmental stratification based on the winning genotypes. Observing Figures 4 and 5 (A and B)Figures 4 and 5A), mega-environment I constitutes locations 1, 2, 3, 4, and 6 (Inconfidentes crop season 13-14, Lavras crop season 13-14, Patos de Minas crop season 13-14, Inconfidentes crop season 14-15, and Patos de Minas crop season 14-15), and mega-environment II constitutes location 5 (Lavras crop season 14-15). It can be verified that in mega-environment I, the cultivars with highest grain yield are 7, 3, 2, and 5, and in mega-environment II, cultivars 14, 8, 12, and 11 for PCA1. On the other hand, when evaluating PCA2, the cultivars with highest grain yield, allied to stability, were 13 and 16. Index Z revealed that, in the mean vs stability approach, for PCA2, cultivars 11, 13 and 7 stood out.

Figure 4: Diagram of GGE biplot. A. Mean grain yield (kg/ha) and B. Z index. Env. 1: 2013/14 Inconfidentes; Env. 2: 2014/15 Inconfidentes; Env. 3: 2013/14 Lavras; Env. 4: 2014/15 Lavras; Env. 5: 2013/14 Patos de Minas; Env. 6: 2014/15 Patos de Minas.

Figure 5: Diagram of GGE biplot. A. Mean grain yield (kg/ha) and B. Z index. Env. 1: 2013/14 Inconfidentes; Env. 2: 2014/15 Inconfidentes; Env. 3: 2013/14 Lavras; Env. 4: 2014/15 Lavras; Env. 5: 2013/14 Patos de Minas; Env. 6: 2014/15 Patos de Minas.
In Figures 4 and 5B there are three mega-environments. Mega-environment I consisted of locations 3, 4 and 5, mega-environment II, of locations 2 and 6, and mega-environment III, of location 1. Cultivars 14, 8, 5, and 15 were prominent in mega-environment I, as cultivars 3 and 4 were in mega-environment II, in PCA1. In mega-environment III, cultivars 9 and 6 were prominent, in PCA1. For PCA2, cultivars 11, 13, 12, and 7 presented higher stability in index Z.
Therefore, it is evident that there is no association between the results, considering the univariate approach (grain yield), when evaluating the selection index Z, applied to the GGE biplot method in the analysis of PCA1, approaching mean vs stability (Figure 4A and B) and GGE biplot (Figure 5A and B).
In Figure 3A and B, which won where approach showed that cultivar 13 (NA 7200) is highlighted in both univariate analysis (grain yield) and index Z. In addition, in the mean vs stability approach and GGE biplot method for PCA2, which reveals that the more stable genotypes are closer to zero, cultivar 13 (NA 7200) is once again more pronounced.
Conclusion
Cultivars NA 7200 RR and CD 2737 RR presented the highest values for the selection index Z in the Graphic method evaluation, considering, simultaneously, the traits of grain yield, uniformity (sieve yield), mass of one thousand grain, and germination test.
Cultivar NA 7200 was prominent based on univariate analysis (grain yield) and Z index, in the GGE biplot method, constituting the cultivar with greater adaptability and stability, considering production and seed quality.
Acknowledgments
The authors wish to thank Conselho Nacional de Desenvolvimento Científico e Tecnológico (CNPq) for granting the scholarship; Fundação de Amparo à Pesquisa do Estado de Minas Gerais (FAPEMIG) for financial support; Instituto Federal do Sul de Minas (IfSuldeMinas) for assistance in experimental setup; Universidade Federal de Lavras (UFLA); and Departamento de Agricultura (DAG) for the opportunity to carry out this study.
About the Authors
Corresponding Author
K.B. Silva
Departamento de Agricultura, Universidade Federal de Lavras, Lavras, MG, Brasil
- Email:
- karina.rbarroso@gmail.com
References
- Allard RW and Bradshaw AD (1964). Implications of genotype-environmental interactions in applied plant breeding. Crop Sci. •••: 503-507. http://dx.doi.org/10.2135/cropsci1964.0011183X000400050021x
- Amira JO, Ojo DK, Ariyo OJ, Oduwaye AO, et al. (2013). Relative discriminating powers of GGE and AMMI models in the selection of tropical soybean genotypes. Afr. Crop Sci. J. 21: 67-73.
- Bárbaro IM, Centurion MAP da C, Di Mauro AO, Unêda-Trevisoli SH, et al. (2007). Comparação de estratégias de seleção no melhoramento de populações F5 de soja. Ceres 54: 250-261.
- Batistella Filho F, Ferreira ME, Vieira RD, Cruz MCP da, et al. (2013). Adubação com fósforo e potássio para produção e qualidade de sementes de soja. Pesq. Agropec. Bras. Brasília. 48: 783-790.
- Bernard RL, et al. (1965). Results of the cooperative uniform soybeans tests. USDA, Washington, 134.
- Brasil (2009). Ministério da Agricultura, Pecuária e Abastecimento. Regras para Análise de Sementes, Brasília, 147-343- 351.
- Cantarelli LD, Schuch LOB, Tavares LC and Rufino C de A (2014). Variabilidade de plantas de soja originadas de sementes de diferentes níveis de qualidade fisiológica. Acta Agron. 64: 234-238. http://dx.doi.org/10.15446/acag.v64n3.45511
- Carraro IM and Peske ST (2005). Uso de sementes de soja no Estado do Paraná. Rev. Bras. Sementes 27: 75-80. http:// dx.doi.org/10.1590/S0101-31222005000200011
- Carvalho ER, Rezende PM, Ogoshi FGA, Botrel EP, et al. (2010). Desempenho de cultivares de soja [Glycine max (L.) Merrill] em cultivo de verão no Sul de Minas Gerais. Cienc. Agrotec. 34: 892-899. http://dx.doi.org/10.1590/S1413- 70542010000400014
- Castro E de M, Oliveira JA, Lima AE, Santos HO, et al. (2016). Physiological quality of soybean seeds produced under artificial rain in the pre-harvesting period. J. Seed Sci. 38: 014-021.
- Conab (2016). Acompanhamento da Safra Brasileira de Grãos. Safra 2015/2016. Nono Levantamento, 123.
- Costa MM, Di Mauro AO, Unêda-Trevisoli SH, Arriel NHC, et al. (2004). Ganho genético por diferentes critérios de seleção em populações segregantes de soja. Pesq. Agropec. Bras. 39: 1095-1102.
- de Pádua GP, França-Neto J de B, Rossi RF and Cândido HG (2014). Agroclimatic zoning of the state of Minas Gerais for the production of high quality soybean seeds. J. Seed Sci. 36: 413-418. http://dx.doi.org/10.1590/2317-1545v36n41023
- DoVale JC, Fritsche-Neto R and Silva PSL (2011). Índice de seleção para cultivares de milho com dupla aptidão: minimilho e milho verde. Bragantia, Campinas 70: 781-787.
- Farias Neto AL, Dianese A de C, Santin MR and Couto BC (2013). Caracterização de genótipos de soja na região dos Cerrados quanto à reação à podridão vermelha da raiz, causada pelos fungos Fusarium tucumaniae e Fusarium brasiliense. Rev. Ceres 60: 215-220. http://dx.doi.org/10.1590/S0034-737X2013000200009
- França-Neto JB, Krzyzanowski FC, Henning AA, Lorini I, et al. (2014). A relação de alto vigor e produtividade. Grana 789: 34-37.
- Frandoloso V, Meneghello GE, André MA, Deuner C, et al. (2015). Physiological quality of soybean seeds produced in four edaphoclimatic regions of Santa Catarina. J. Seed Sci. 37: 226-233. http://dx.doi.org/10.1590/2317- 1545v37n3150086
- Gomes GDR, Benin G, Rosinha RC, Galvan D, et al. (2012). Produção e qualidade fisiológica de sementes de soja em diferentes ambientes de cultivo. Semin. Cienc. Agrar. 33: 2593-2604. http://dx.doi.org/10.5433/1679- 0359.2012v33Supl1p2593
- Gonçalves Neto AC, Maluf WR, Gomes LAA, Gonçalves RJS, et al. (2011). Aptidões de genótipos de batata-doce para consumo humano, produção de etanol e alimentação animal. Pesq. Agropec. Bras. 46: 1513-1520.
- Lima LK, Ramalho MAP and Abreu AFB (2012). Implications of the progeny x environment interaction in selection index involving characteristics of the common bean. Genet. Mol. Res. 11: 4093-4099. PubMed http://dx.doi. org/10.4238/2012.September.19.5
- Marcos-Filho J (2013). Importância do potencial fisiológico da semente de soja. Informativo Abrates, 23.
- Mendes FF, Ramalho MAP and Abreu AFB (2009). Índice de seleção para escolha de populações segregantes de feijoeirocomum. Pesq. Agropec. Bras. 44: 1312-1318. http://dx.doi.org/10.1590/S0100-204X2009001000015
- Meotti GV, Benin B, Silva RR, Beche E, et al. (2012). Épocas de semeadura e desempenho agronômico de cultivares de soja. Pesq. Agropec. Bras. 47: 14-21. http://dx.doi.org/10.1590/S0100-204X2012000100003
- Nunes JAR, Ramalho MAP and Abreu AFB (2005). Graphical method in studies of adaptability and stability of cultivars. Annu. Rep. Bean Improv. Coop. 48: 182-183.
- Oliveira RL, Von Pinho RG, Balestre M and Ferreira DV (2010). Evaluation of maize hybrids and environmental stratification by the methods AMMI and GGE biplot. Crop Breed. Appl. Biotechnol. 10: 247-253. http://dx.doi. org/10.1590/S1984-70332010000300010
- Pimentel-Gomes F (2009). Curso de estatística experimental. 15a Ed. Piracicaba: FEALQ. 451.
- Ramalho MAP, Abreu A de FB, dos Santos JB and Rodrigues Nunes JA (2012). Aplicações da Genética Quantitativa no Melhoramento de Plantas Autógamas. UFLA, Lavras.
- Regitano Neto A, Ramos EU, Junior, Gallo PB, Freitas JG, et al. (2013). Comportamento de genótipos de arroz de terras altas no estado de São Paulo. Rev. Ciência Agronômica 44: 512-519. http://dx.doi.org/10.1590/S1806- 66902013000300013
- Reis CAF, Gonçalves FMA, Ramalho MAP and Rosado AM (2011). Seleção de progênies de eucalipto pelo índice Z por MQM e Blup. Pesq. Agropec. Bras. 46: 517-523.
- Reis CAF, Gonçalves FMA, Ramalho MAP and Rosado AM (2015). Estratégias na seleção simultânea de vários caracteres no melhoramento do Eucalyptus. Ciência Florestal. Santa Maria 25: 457-467.
- Resende MDV and Duarte JB (2007). Precisão e controle de qualidade em experimentos de avaliação de cultivares. Pesqui. Agropecu. Trop. 3: 182-194.
- Rezende PM and Carvalho E de A (2007). Avaliação de cultivares de soja [Glycine max (L.) Merrill] para o sul de Minas Gerais. Cienc. Agrotec. 31: 1616-1623.
- Ribeiro ND, et al. (2014). Desempenho agronômico e qualidade de cozimento de linhagens de feijão de grãos especiais. Revista Ciência Agronômica 45: 92-100. http://dx.doi.org/10.1590/S1806-66902014000100012
- Silva KB, Bruzi AT, Zuffo AM, Zambiazzi EV, et al. (2015). Adaptability and phenotypic stability of soybean cultivars for grain yield and oil content. Genet. Mol. Res. 15: gmr.15026756
- Soares IO, Rezende PM, Bruzi AT, Zambiazzi EV, et al. (2015). Adaptability of soybean cultivars in different crop years. Genet. Mol. Res. 14: 8995-9003. PubMed http://dx.doi.org/10.4238/2015.August.7.8
- Souza DMG and Lobato E (2004). Cerrado: correção do solo e adubação. 2ed. Brasília: Embrapa Informação Tecnológica; Planaltina: Embrapa Cerrados, 416.
- de Vasconcelos ES, Reis MS, Sediyama T and Cruz CD (2015). Produtividade de grãos, adaptabilidade e estabilidade de genótipos de soja de ciclos precoce e médio. Semina. Ciências Agrárias, Londrina 36: 1203-1214.
- Xavier T da S, Daronch DJ, Peluzio JM, Afférri FS, et al. (2015). Época de colheita na qualidade de sementes de genótipos de soja. Comunicata Scientiae 6: 241-245.
- Yan W, Hunt LA, Sheng Q and Szlavnics Z (2000). Cultivar evaluation and mega-environment investigation based on the GGE biplot. Crop Sci. 40: 597-605. http://dx.doi.org/10.2135/cropsci2000.403597x
- Yan W, Hunt LA, Johnson P, Stewart G, et al. (2002). On-Farm strip trials vs. Replicated Performance trials for cultivar evaluation. Crop Sci. 42: 385-392. http://dx.doi.org/10.2135/cropsci2002.0385
Keywords:
Download:
Full PDF- Share This